The List screen provides a list of site cards for all available sites. A number of tools are provided to control the display of the sites in the list.
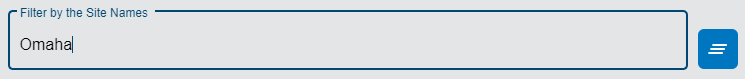
• The Filter by field can be used to search for a specific site using any of the characters that appear in the site's name. As characters are entered in the field, the list of available sites will be filtered. The text is matched to consecutive characters in the site names. The filter is not case sensitive therefore upper or lower case characters can be entered. The filter terms are remembered when you leave the page and are automatically reapplied if you return. The relevant site can then be selected from the list. The Clear all filters button can be used to clear the filtering of the site list.
• The Sort by buttons can be used to sort the list either by site name or by the number of alarms associated with each site. The buttons function as a toggle, switching from one sort order to the other when the buttons are clicked. The active button is coloured white.
• The Show Inactive Sites button can be used to enable or disable the display of inactive sites in the list. When enabled, inactive site cards appear greyed out. When disabled, inactive sites will not be included in the list. This option is enabled when the button is blue and pointing to the right. When disabled, the button will be white and pointing to the left.
• The Import Flowlink CSV button launches the Data Import Utility which can be used to import CSV format site data generated in Flowlink 5. New site cards will be added for the sites imported from the CSV data.
To import a file:
• Define the delimiter used in the CSV data; comma is used by default.
• Drag a source file into the utility window.
• Click the Import Flowlink CSV button in the utility.
The List page also provides a notification tool. When this tool is enabled, you will receive a notification each time a new site is added. The method of notification will depend on the notification settings in the profile of the current user. The Notification tool at the top of the page will receive a notification by default, but notifications can also come in the form of an email or a text message. See User Profile for more information on notification settings. This option is enabled when the button is blue and pointing to the right. When disabled, the button will be white and pointing to the left.
Each site card in the list provides access to information for the sensors at a site location. Each site card has two modes of displaying information and action buttons:
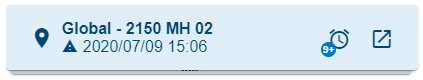
• By default, without the cursor hovering over the site card, the card displays the site name, the elapsed time since data was received from the site, and the last received values from all voltage type data. There are also two action buttons described in the table below.
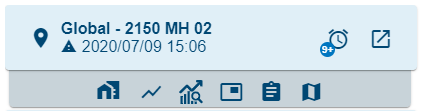
• When the cursor is hovering over the site card, a set of action buttons appear below the card, as shown in the image below. These buttons are described in the table below.
Expand each section by clicking the arrow at the end of each heading.
View Alarm
View the details of an alarm that has been triggered for the selected site. This button is only present when an alarm has been triggered.
1. Click Alarm in the site card.
Information about the alarm is displayed. Once the alarm has been acknowledged, the Alarm button will be removed from the site card.
Go to Site
View detailed information about the selected site.
1. Click the Go to Site button in the site card.
The site page for the sensor is displayed. See Site Information for more information about this page.
Change Tenant
Change the tenant to which the site is currently assigned.
1. Click the Change Tenant button in the site card.
2. Select a tenant from the list displayed.
This option is only available if the Tenants functionality has been enabled on the Settings page. See Settings for more information about this option.
Level, Flow and Velocity from Site
Create a graph of level, flow and velocity data from the selected site using the default public template named Level, Velocity, Flow Rate template, which is found in the Public Templates table of the Graph Templates screen.
1. Click the Level, Flow and Velocity from Site button in the site card.
The Create New Graph screen is displayed. If the selected site has level, flow and velocity datasets, then the graph is populated for preview, otherwise a message will be displayed identifying the missing dataset(s). See Configure Graph for information on creating graphs.
Graph from Site
Create a new graph from datasets from the site.
1. Click the Graph from Site button in the site card.
The Create New Graph screen is displayed. See Configure Graph for information on creating graphs.
Graph Site from Template
Create a new graph of datasets from the site using an existing graph template.
1. Click the Graph Sitefrom Template button in the site card.
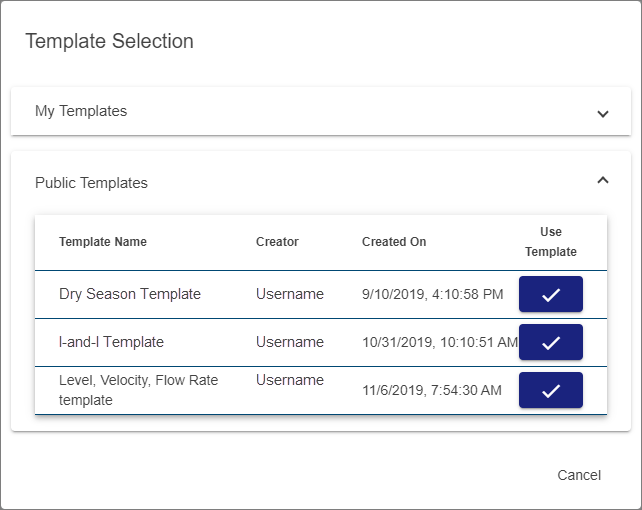
The Template Selection dialog box is displayed.
This dialog box contains two drop-down lists, one for templates created by the current user and one for public templates created and shared by another user.
2. Expand the My Templates or Public Templates list.
3. Click the Use Template button for the desired template.
The Create New Graph screen is displayed populated according to the selected template. See Configure Graph for information on creating graphs.
Compute Datasets from Site
Compute a dataset using data from the selected site.
1. Click the Compute Datasets from Site button in the site card.
The Compute Datasets page is displayed. See Compute Dataset for information on computing a dataset.
See on Map
View the location of the site in the Map page.
1. Click the See on Map button in the site card.
The Map screen is displayed. The map is centered on the sensor location.
2. To zoom into or out of the map, click the Zoom buttons.
3. Click Listto go back to the List view of the Sites page.


 launches the Data Import Utility which can be used to import CSV format site data generated in Flowlink 5. New site cards will be added for the sites imported from the CSV data.
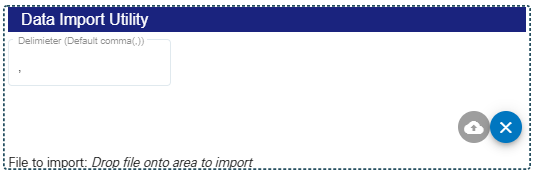
 When this tool is enabled, you will receive a notification each time a new site is added. The method of notification will depend on the notification settings in the profile of the current user. The Notification tool at the top of the page will receive a notification by default, but notifications can also come in the form of an email or a text message. See