The Map page displays a map of all accessible site locations. The map is sourced by OpenStreetMap.
1. To zoom into the map, do any of the following:
• Click the + icon in the top-left corner of the map.
• Double-click the mouse.
• Rotate the middle mouse wheel forward.
2. To zoom out, do either of the following:
• Click the - icon in the top-left corner of the map.
• Rotate the middle mouse wheel in reverse.
3. To pan the map, press and hold the mouse button and move the mouse.
4. To view information about a site, click a point-of-interest (POI) icon on the map.
The POI icon for sites with alarms that have not been acknowledged will be displayed in red. |
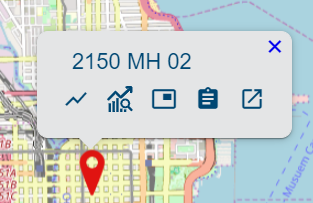
The map is automatically zoomed and centered on the selected icon and a pop-up containing site information is displayed.
You can access other Flowlink Cipher functions by clicking the buttons in this message. Expand each section in the table below to view a description of each button.
| Level, Flow and Velocity from Site Create a graph of level, flow and velocity data from the selected site using a default template. 1. Click the Level, Flow and Velocity from Site button in the site card. The Create New Graph screen is displayed. If the selected site has level, flow and velocity datasets, then the graph is populated for preview, otherwise a message will be displayed identifying the missing dataset(s). See Configure Graph for information on creating graphs. |
| Graph from Site Create a new graph from datasets from the site. 1. Click the Graph from Site button in the site card. The Create New Graph screen is displayed. See Configure Graph for information on creating graphs. |
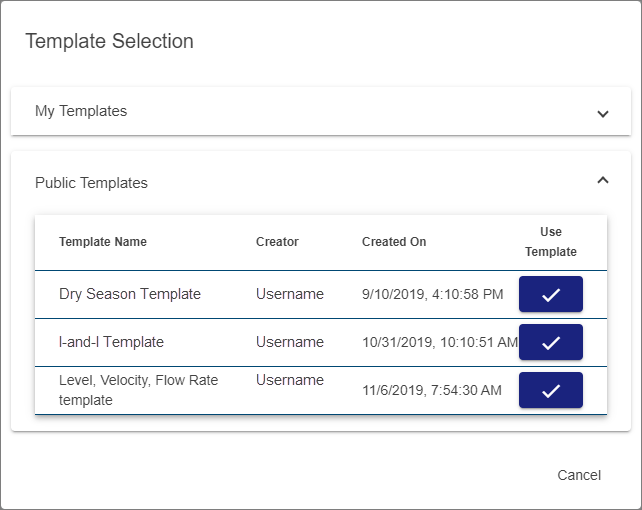
| Graph Site from Template Create a new graph of datasets from the site using an existing graph template. 1. Click the Graph Site from Template button in the site card. The Template Selection dialog box is displayed.
This dialog box contains two drop-down lists, one for templates created by the current user and one for public templates created and shared by another user. 2. Expand the My Templates or Public Templates list. 3. Click the Use Template button for the desired template. The Create New Graph screen is displayed populated according to the selected template. See Configure Graph for information on creating graphs. |
| Compute Datasets from Site Compute a dataset using data from the selected site. 1. Click the Compute Datasets from Site button in the site card. The Compute Datasets page is displayed. See Compute Dataset for information on computing a dataset. |
| Go to Site View detailed information about the selected site. 1. Click the Go to Site button in the site card. The site page for the sensor is displayed. See Site Information for more information about this page. |
Related topics:
• Sites