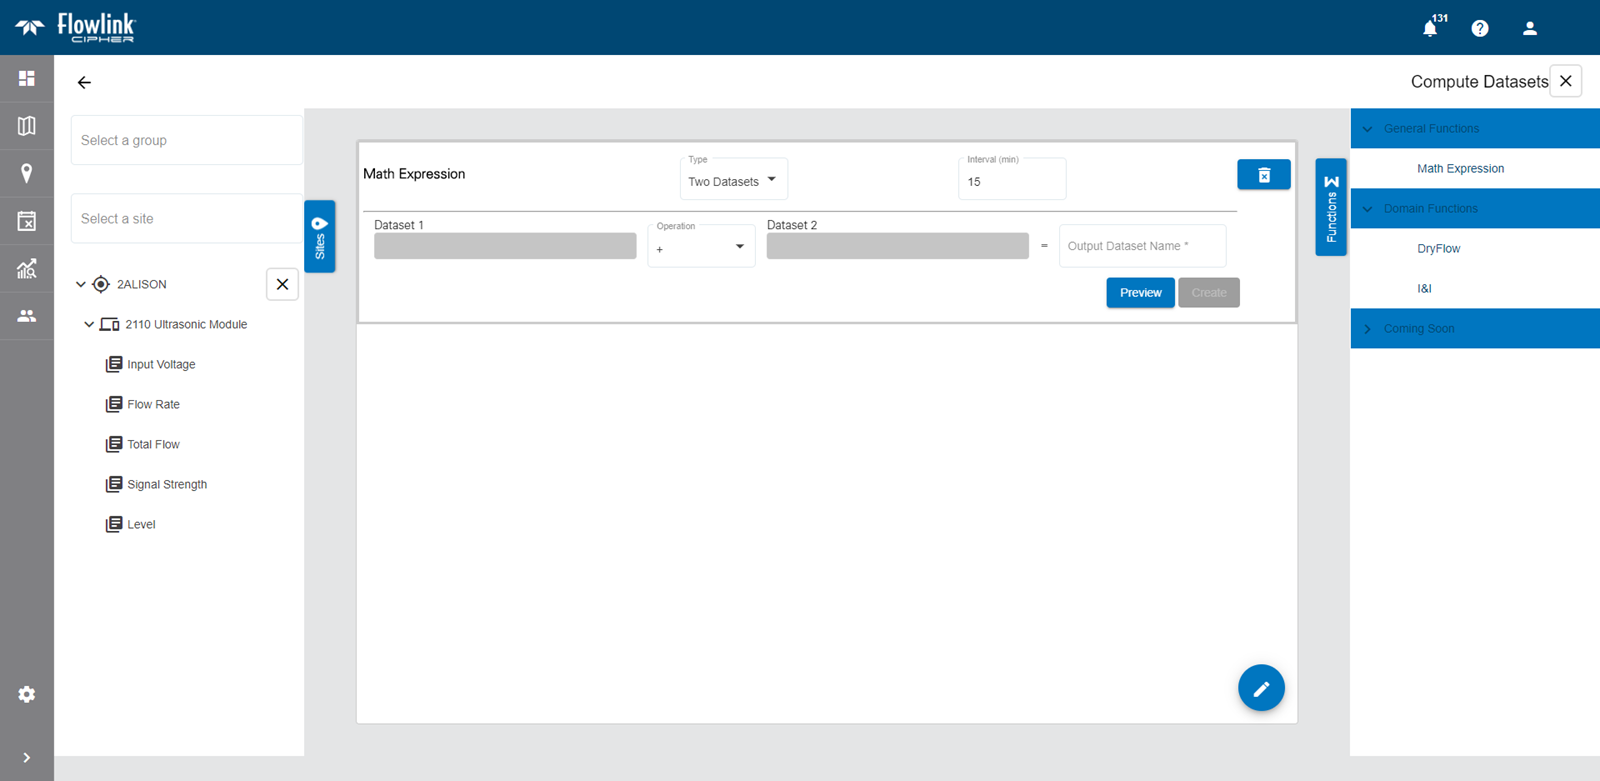
The Compute Dataset screen is used to create a dataset using the data from existing ingested datasets. This dataset can then be used in a graph or to compute additional datasets. For example, to create an I&I dataset, you must first create a Dry Flow dataset.
The functions available for creating a dataset are listed on the right side of the page. Different functions are provided for different tasks.
• The General Functions group contains the Math Expression function, which can be used to compute a dataset by applying a mathematical expression to one or more existing datasets.
• The Domain Functions group contains functions that are specific to certain tasks, including dry flow calculation and I&I calculation.
Once a function has been selected, this list can be collapsed by clicking the Functions button  .
.
To compute a dataset using the Math Expression function:
1. Using the left mouse button, click and drag the Math Expression function into the middle of the page.
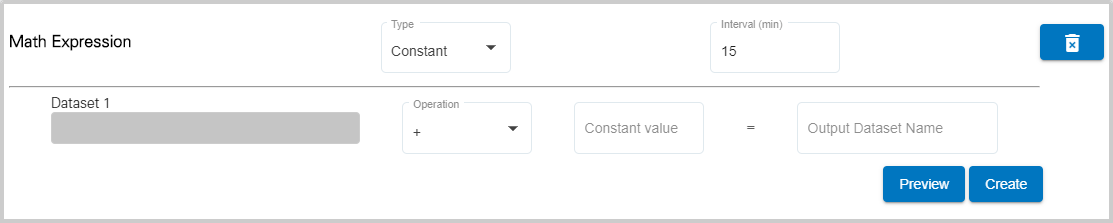
The Type field is used to choose whether the expression will use data from 2 datasets, or if a constant value will be applied to a single dataset.
2. Select an option from the Type drop-down list.
The Interval (min) field is used to specify the frequency with which points will be created in the computed dataset, measured in minutes. The default interval is 15 minutes.
3. Enter a value in the Interval (min) field.
The fields provided to build the math expression will differ based on the selected type. When creating a constant-value expression, the following fields will be displayed:
For a two-dataset expression, the following fields will be displayed:
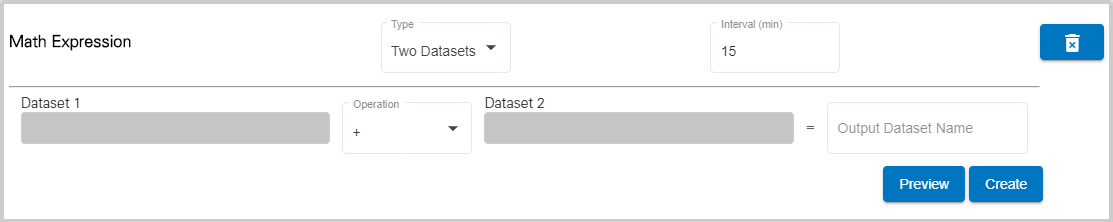
The Dataset field(s) are populated with the dataset(s) you want to include in the expression. These fields are populated by selecting a dataset from the Sites list on the left of the page. Like the Functions list, this list can also be collapsed, using the Sites button, once datasets have been selected. 
4. [Optional] Select a site group from the Select a group list. This will filter the sites list to only those sites in the selected group.
5. Select a site from the Select a site list.
All datasets associated with the site are displayed below the site list. If the required datasets come from more than one site, additional sites can be selected from the site list. Each time a site is selected, the list of available datasets is added below the site list.
6. Click a site name in the dataset list to view the available datasets.
7. Click a dataset in the list, keeping the mouse button pressed, and drag it into the relevant Dataset field.
8. If building a two-dataset expression, repeat Step 7 with a second dataset.
9. Select a mathematical Operator from the drop-down list.
10. If building a constant-value expression, enter the value to be applied to the data in the Constant value field.
11. Enter a name for the computed dataset in the Output Dataset Name field.
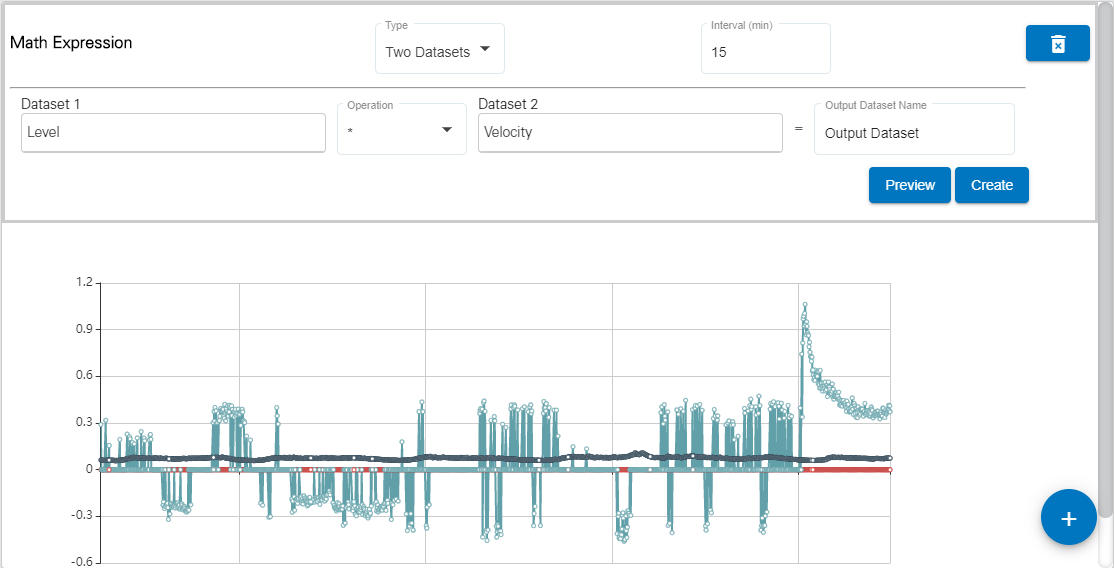
The Preview button can be used to view the resulting dataset in a sample graph below the expression fields. Like a regular graph, the mouse can be used to pan and zoom the data in the preview, and moving the cursor around the graph will display a tooltip populated with the data values at the cursor’s location.
12. Click the Create button to finish creating the dataset.
The page remains open and the new dataset is added to the Sites list under a Computed Datasets category. The plus button  in the bottom-right corner of the page can be used to go to the Configure Graph page with the site preselected. From here a graph can be created using the new computed dataset. See Configure Graph for information on this page.