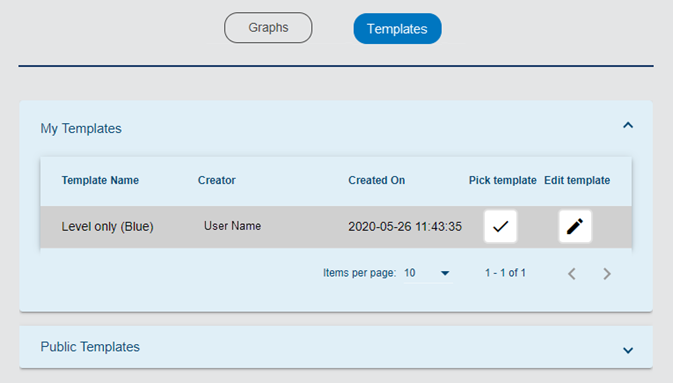
The Templates screen of the Analysis page provides templates that can be used to create new graphs. The available templates are provided in expandable lists. One list, My Templates, contains templates created by the current user. The other list, Public Templates, contains templates created by other users that have been designated as public.
Controls are provided in both lists to control the number of templates displayed in the list. If the number of available templates exceeds the number of templates selected for display, additional pages are added in the list. These pages can be viewed using the left and right arrow buttons.
Templates are created in the Create New Graph page when manually creating a new graph. See Configure Graph for information on this page. They contain all graph property settings defined on the graph creation page, such as the graph type; line shape, width and color; units of measure and data type. When a graph is created from a template, all properties for the new graph will be defined according to the settings in the template.
To create a graph from a template:
1. Expand the relevant template list.
2. Click the blue check mark button in the Pick template column for the relevant template.
A dialogue box is displayed that lists the properties settings of the template.
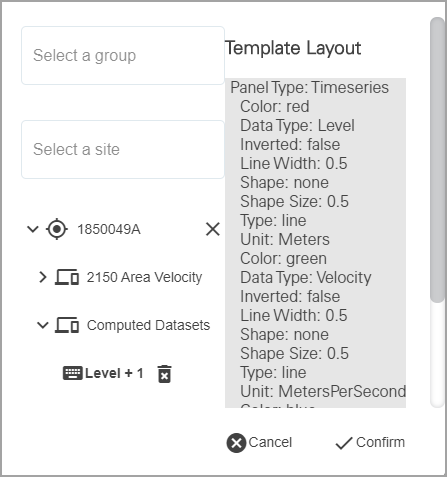
This dialog box is used to select the site and dataset to use as the data source for the new graph.
3. [Optional] Select a site group from the group drop-down list to filter the sites included in the site list.
4. Select the source site from the site drop-down list.
5. Select a dataset to populate the graph.
6. Click Confirm.
The Configure Graph page is displayed, populated with the predefined settings from the template. When this page is launched from a template, a Change Template button is added to the Save as Template field  . This button can be used to update the template with any property settings applied in the Configure Graph page. See Configure Graph for information on this page.
7. Complete any necessary fields.
8. Click Create graph.
The new graph is created.
Templates can also be edited in this screen. To edit a template:
1. Click the Edit template button  to open the Template Editor dialog box.
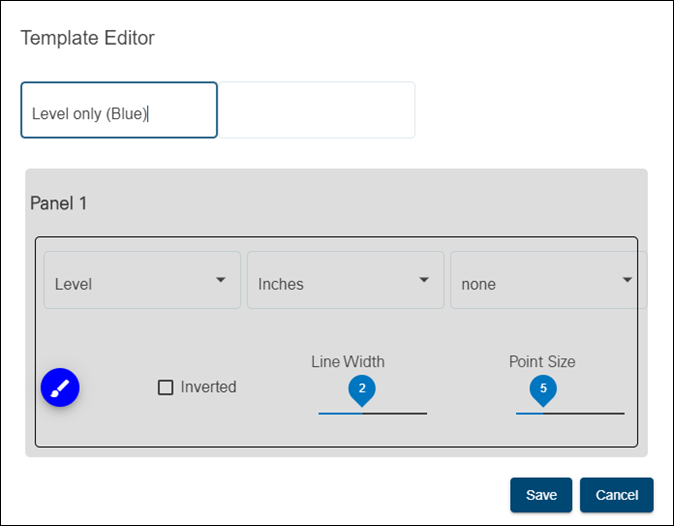
This dialog box provides fields to change the Title and Description of the template. It also provides a section of properties for each panel in the template. The properties that can be changed for each panel include dataset type, units, point symbol shape, point size, color, line width and a switch to invert the dataset in the graph.
2. Adjust the properties as needed.
3. Click Save to exit the dialog box and save the changes to the template.