Menu | Tools > Editors > Subset > Open/Close Editor |
Subset Editor can be used to analyze and edit CZMIL point data that has been georeferenced. In this editor, there are 2D and 3D views to provide close-up views of a user-defined subset of data from the open dataset. Refer to Subset Editor for detailed information on this editor.
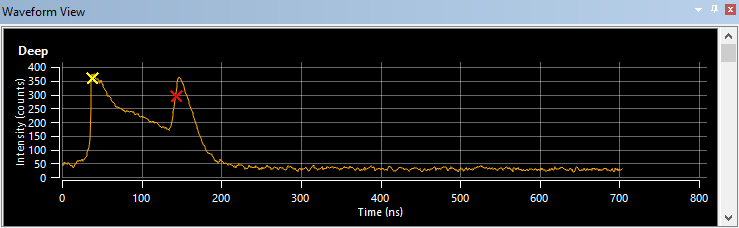
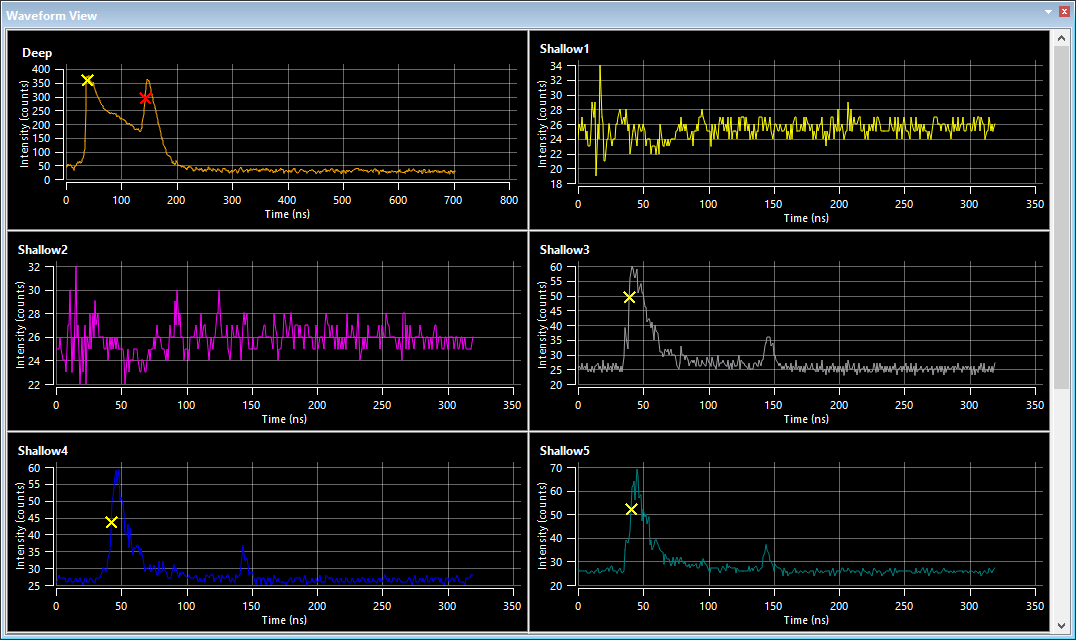
When working with CZMIL data, the Subset Editor also provides a Waveform view. This view provides a tiled view of graphs, which is populated when a subset has been defined and points are selected within the subset. Each graph represents a channel in the data selected within the subset. This data is displayed as the waveform for the superselected point in the channel. On the waveform, returns are represented by Xs on the graph. These Xs are colour coded to identify the return they represent, for example, a yellow X is a water surface return, red is a bathymetric return, green represents the superselected point and grey is anything else.
The graphs in the view are displayed differently depending on the size and location of the window. A single graph is displayed by default and each additional graph can be viewed by scrolling in the window. Expanding the window size will add more graphs to the view both vertically and horizontally. The window can be undocked to maximize the viewing space and see all available graphs.
A Maximize/Minimize toggle button  is available in the top-right corner of each graph when the mouse cursor is positioned in a graph tile. This toggle can be used to automatically expand the graph to fill the available window space or return the graph to the default collapsed size.
When viewing a graph, it is possible to zoom and pan within the data in the same manner as the 2D and 3D views. See Subset Editor Interface for information on navigating within Subset Editor views.
The Properties window also provides controls for viewing waveform data, allowing more than one channel to be displayed within a single graph.
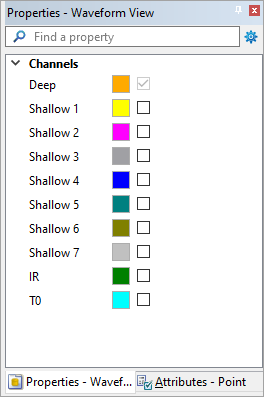
To enable multiple channels in a single graph:
1. Click the graph to make it active, a teal highlight will be added around the active graph.
2. Click the check box of each channel in the Properties window to be included in the graph.
Procedure
To view CZMIL data in Subset Editor:
1. Open a CZMIL dataset.
2. Select the Open Subset Editor command.
The Subset Editor windows are added to the interface and the cursor changes to allow a subset to be defined.
3. Click and drag in the 2D View display window to create a bounding box around the data to be included in the subset.
The Subset Editor 2D and 3D views will be populated with the points in the subset.
4. Select points within either of the subset views to create a selection.
5. To populate the Waveform view, click a point to superselect it in the Selection window.
Once data is populated in the necessary views, data can be flagged or reprocessed as needed. See Filter CZMIL Points and Reprocess Data As... for more information.
Image Preview
Also provided in the Subset Editor when working with CZMIL data is the Image Preview window. If the CZMIL data directory contains a Camera folder populated with camera images, this window will automatically display the nearest image for the data currently being viewed. These images can be used as a reference when editing data. Camera images will only be present if the Convert Camera Images process has been run. See Convert Camera Images for information on this process.
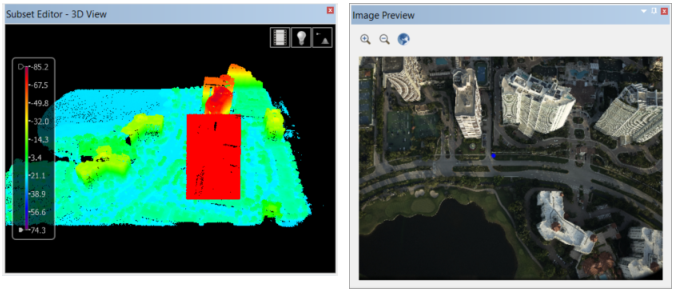
As different data areas are examined, the image in the window will change if a nearer image is available. A blue dot will also be displayed in the image indicating the location of the currently superselected point. In order for this dot to be positioned accurately, a Camera Calibration Parameter (.ccp) file must be defined and placed in the Camera folder of the CZMIL data directory. Expand the section below to view information on CCP files.
To populate the Image Preview window:
1. Load a subset for an area for which camera images are available.
2. Select the relevant area of data in the 3D View.
3. Superselect a point in the Selection window.
If an image is available for the selected area, it will be displayed in the Image Preview window. Superselecting different points will update the image and/or blue dot in the preview.
Camera Calibration Parameter Files
A Camera Calibration Parameter (.ccp) file is used to calibrate the display of camera images in the Image Preview window when working with CZMIL data. This file ensures that the blue dot displayed on an image is placed accurately in relation to the superselected data point. Without a CCP file, the blue dot location indicator will not be displayed in the Image Preview window.
CCP files are created in XML language and are specific to the camera model being used. Below is an example of a CCP file for a Phase1 - LMS 4.3 camera.
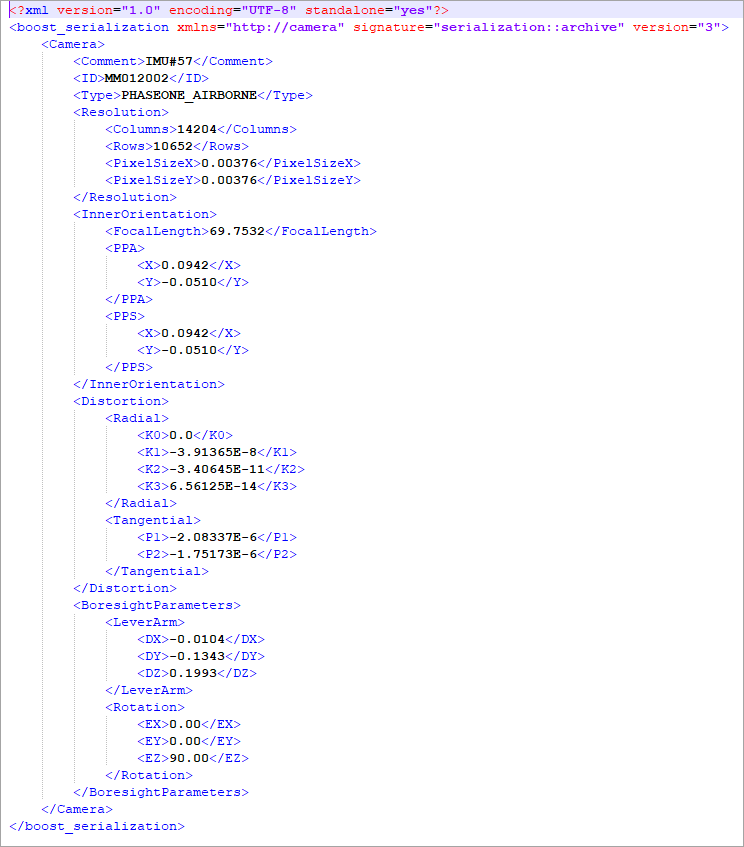
In addition to camera model, each camera also comes calibrated for 3 different software packages (Australis, USGS, INPHO). The parameters specified in the CCP file must match the camera model and software solution that was used to collect the data and images, and process them in LMS. This information can be found in the Phase One laboratory calibration report provided with every camera. The table below lists the parameters in the CCP file that must be updated with the camera and software-specific values from the calibration report:
Parameter | Value |
|---|---|
Camera Model Type (All Software Solutions) | The Type parameter must be updated with the identifier for the camera model being used. The possible values are: • Phase1 – LMS 4.2: <Type> IXU1000</Type> • Phase1 – LMS 4.3: <Type>PHASEONE_AIRBORNE</Type> • CM 6500: <Type>CM6500</Type> • CM 6500 & Eclipse: <Type>ECLIPSE_CM6500</Type> • CS 10000: <Type>CM10000</Type> |
Camera Resolution (All Software Solutions) | The Resolution parameter must be updated by specifying the relevant values for: • Columns • Rows • PixelSizeX • PixelSizeY |
Inner Orientation (Australis Only) | The Focal Length parameter must be updated with the relevant focal length value. |
The PPA parameter must be updated by replacing the X and Y values with the Principal Point Offset values for XP and YP. | |
The PPS parameter must be updated by replacing the X and Y values with the Principal Point Offset values for XP and YP. | |
Distortion (Australis Only) | The Radial Distortion values must be updated by replacing the Radial K1, K2 and K3 values with the values from the report and reversing the signs for the values. |
The Radial-Asymmetric and Tangential Distortion values must be updated by replacing the Tangential P1 and P2 values with the values from the report and reversing the signs for the values. | |
Boresight Parameters (Australis Only) | The LeverArm parameter must be updated by replacing the DX, DY and DZ values with X, Y and Z values for the IMU Camera values in the report. Be sure select the correct camera size when choosing the IMU values. |
The Rotation parameters should be updated with the roll, pitch and yaw/heading values to be applied to the data according to the values in the calibration report. These values should be entered in degrees. • EX = Roll • EY = Pitch • EZ = Yaw/Heading |
Once a file has been populated with the parameter values for the camera and software solution being used, the file can be saved to the Camera folder of the CZMIL data directory. This location must have been specified when creating the survey file for the CZMIL data in order for the images to be displayed in the preview window. Any name can be used for the file, as long as the .ccp file extension is used.