![]() CARIS HPD Paper Chart Editor
CARIS HPD Paper Chart Editor
![]() CARIS Paper Chart Composer
CARIS Paper Chart Composer
Menu | File > Export > PNG |
Export a sheet, current view or Source View to a PNG image.
Related commands
• • • • • • | • • • • • |
Interface
Some options are available in both Source and Sheet View while other options are available in Sheet View only. See descriptions below for option availability. |
Properties | Description |
|---|---|
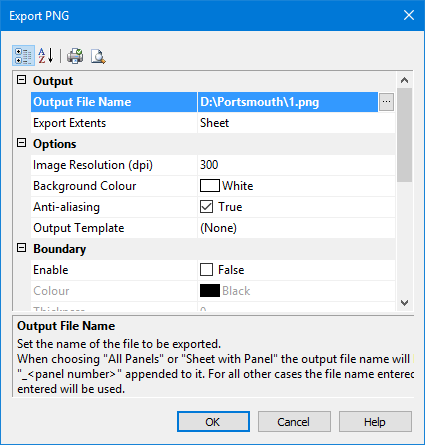
Output | |
Output File Name | Name and location of the output file. If Source View is visible, this field is empty; if a panel view or Sheet View is visible, the default location is Available in both Source View and Sheet View Select a location and name for the file. |
Export Extents | The following options are available: • Sheet: Export the chart sheet as a PNG image • Inked area of the sheet to export only those areas of the chart with content. • Current View: Export the area of Source or Sheet/Panel View that is currently in view. Select an option from the list. Available in Sheet View Only. |
Options | |
Ground Resolution | Size of one pixel on the ground in metres. This option is only available if exporting from Source View. Available in both Source View and Sheet View. Type a value in the field. |
Image Resolution | Image resolution of the TIFF in Dots-Per-Inch (DPI). Available in both Source View and Sheet View Type a value. |
Background Colour | Set a colour fill for areas of the sheet without data. Available in both Source View and Sheet View Select a colour from the colour picker or create a custom colour from the palette. |
Anti-aliasing | Smooth the image and remove jagged edges. Available in both Source View and Sheet View select the Anti-aliasing check box. |
Output Template | Templates control what layers and feature are exported to the TIFF chart. Available in Sheet View Only. Select an existing template or select |
Boundary | |
Enable | Create a boundary around the chart. Available in Sheet View only. Click the check box. |
Colour | Colour of the boundary line. Available in Sheet View only. Select a colour from the list or create a custom colour using the colour palette. |
Thickness | Thickness of the boundary line in millimetres. A value of 0 means that the line is one pixel wide. Available in Sheet View only. Type a value. |
Annotation | |
Enable | Include an annotation in the chart. Available in Sheet View only. Click the check box. |
Style | Font for the annotation. Available in Sheet View only. Select a font from the list. |
Text | Annotation text Available in Sheet View only. Type the text. |
Username | Add Windows login name to annotation. Available in Sheet View only. Select the check box |
Time Stamp | Add a time stamp of the export. The format is year-month-day hour:minute:second Available in Sheet View only. Select the check box |
Justification | Justification for annotation. Available in Sheet View only. Select from the list |
Position | Position of annotation with respect to the image. Available in Sheet View only. Select a position from the list. |
Offset | Offset of annotation from the edge of image in millimetres. Negative values move the text inside the map extent; positive values away from the map extent. Available in Sheet View only. Type a value. |
Indent | Indent (in millimetres) right- or left-justified annotation text from the origin. Available in Sheet View only. Type a value. |
Information | |
Width (Pixels) | Read-only width value is determined by resolution. Available in both Source View and Sheet View. |
Height (Pixels) | Read-only height value is determined by resolution. Available in both Source View and Sheet View. |
Procedure
1. Select a chart or source layer.
2. [Optional] Zoom into the area that you want to export.
3. Select the Export to PNG command.
The Export PNG dialog box is displayed.
4. Define any necessary properties and click OK.
A progress bar appears.
To cancel the export at any time, select the Esc key and confirm your action by clicking Yes in the pop-up window.