Tool | CZMIL > 03 - Georeference CZMIL data to create point cloud (Tools window) |
The Georeference CZMIL Data process model converts CZMIL CWF waveform and SBET trajectory data into a georeferenced point cloud. During this conversion, roll, pitch, and heading corrections are applied to generate point cloud data referenced to ellipsoid height.
Every point in the point cloud is also assigned a land/water confidence value during processing. This value is used to identify points as either land or water, which is needed when determining the seafloor. A Land-Water Confidence band is included the output point cloud and can be used to access the confidence values assigned to each point. The land/water classification is controlled by the settings for various lidar parameters; see Edit Lidar Parameters for information on the parameters.
CARIS Batch process: Georeference CZMIL Points
Related commands:
Interface
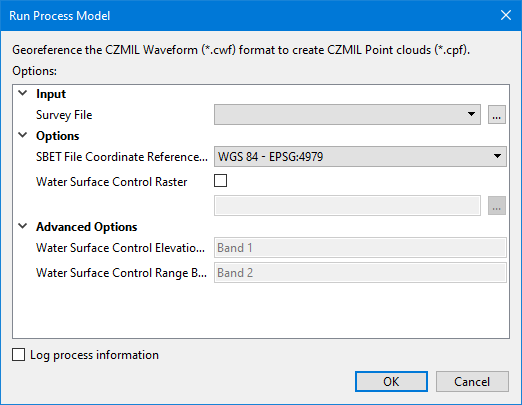
The options in this process model include:
Option | Description |
|---|---|
Survey File | The name and location of the survey file containing the survey lines of CZMIL data. If a survey file is open in the application, a drop-down list is also provided for this option. The drop-down list allows a survey layer open in the application or the current selection (if a survey line is selected) to be used as the input survey. 1. Click the browse button (...) to launch an Open file dialog box. 2. Navigate to the relevant file. 3. Click Open. |
SBET Files Coordinate Reference System | The Geographic coordinate reference system (CRS) used to store the Applanix SBET file. This information is stored in the header of the CPF file as the CRS of the CPF file depends on the CRS of the SBET file and is used for future processing, such as exporting the CPF to LAS. NAD 83 and WGS 84 are currently supported. 1. Select a CRS from the drop-down list. |
Water Surface Control Raster | Apply a GeoTIFF raster surface (.tiff) as a representation of the water surface. This is used to help determine the depth of the seafloor when water shots have missing or unreliable surface returns. The values in the raster that will be used for the water surface is controlled by the bands specified for the Water Surface Control Elevation Band and the Water Surface Control Range band. This tells the process where to find the elevation values and the range of values within the elevation band that will be used. 1. Click the check box to enable the option. 2. Click the browse button (...) to launch the Open File dialog box. 3. Navigate to the relevant raster file and click Open. |
Water Surface Control Elevation Band | The name of the band in the water surface control raster that contains the elevation values to be used as the water surface. The points that will contribute to the water surface is defined by the values found in the specified Range band. 1. Type the name of the band from the control raster in the field. |
Water Surface Control Range Band | The name of the band in the water surface control raster that contains distances above and below the water surface that are considered to be within the margin of error for being the water surface. This defines the range of elevation values that will contribute to the water surface determination when processing the points in the specified Elevation band. If this option is not specified, range estimates are automatically calculated for each point in the specified raster. The range will be clipped to the water surface window size specified in the lidar parameters for the dataset. 1. Type the name of the band from the control raster in the field. |
Log process information | Create a log file containing the options specified when the process was run. The location of the log file is determined by the Logs setting in Tools > Options > Files and Folders. 1. Click the check box to enable this option. |
Procedure
1. Double-click the Georeference CZMIL data... process model in the Tools window.
The Run Process Model dialog box is displayed, populated with the Georeference CZMIL data process model.
2. Navigate to the relevant Survey File.
3. If applying a Water Surface Control Raster, select the file and specify the bands containing the relevant values.
4. Click OK.
A progress dialog box is displayed providing progress information as the data is converted. Similar information is also reported in the Output window.
5. Click Close to complete the process.