![]() CARIS HPD Paper Chart Editor
CARIS HPD Paper Chart Editor
![]() CARIS HPD Product Editor
CARIS HPD Product Editor
![]() CARIS HPD Source Editor
CARIS HPD Source Editor
Menu | Create > Areas > Marker Grid |
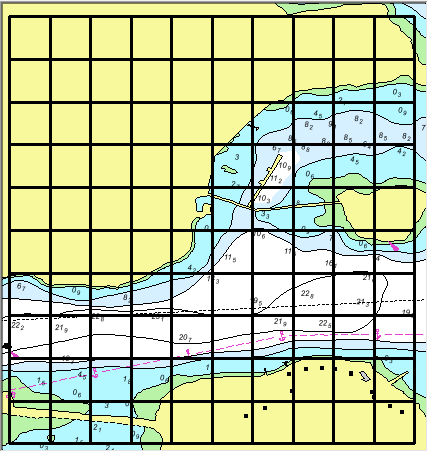
Draw a grid of markers in the Display window.
The origin of the grid is the top left. Rows are identified by letters and columns by numbers. For example, a 10x10 grid starts at cell A1 and ends with cell J10.
Each cell in the grid is a marker, and they are listed in the Markers window. Information about a selected grid marker is displayed in the Marker Details window.
To zoom and centre on a grid marker, double-click on it in the Markers window.
Grid markers can be modified using these commands, available in a pop-up menu in the Markers window:
Grid markers can be used to keep track of the areas that have been checked in a project.
The marker grid is associated with a project.
Related commands:
• • • • • | • • • • |
Interface
Option | Description |
|---|---|
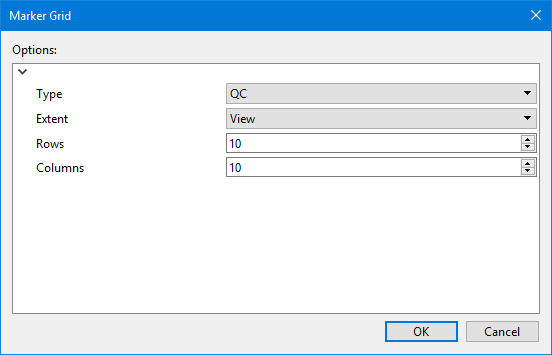
Type | The type of marker. Select from the list. |
Extent | The extent of the grid. This can be: • the project extent • the current view |
Rows | The number of rows in the grid. This, along with the value of Columns, determines the size of each marker as well as the number of markers. Use the up and down arrows to select a value or type the value directly in the box. |
Columns | The number of columns in the grid. This, along with the value of Rows, determines the size of each marker as well as the number of markers. Use the up and down arrows to select a value or type the value directly in the box. |
Procedure
1. [Optional] Zoom into the area of the project you are marking.
2. Select the Create Marker Grid command.
The Marker Grid dialog box is displayed.
3. Set any necessary options.
4. Click OK.
The grid is created, but it may not be visible.
5. If you have not already done so, make the Markers layer visible.
6. Refresh the display.
The grid is displayed.