![]() CARIS HPD Paper Chart Editor
CARIS HPD Paper Chart Editor
Menu | File > Import > Panel Data > [layer] |
Pop-up | Panel Data > [layer] (Layers window) |
Populate a panel with features from a source usage that fall within a panel boundary.
A panel area must be digitized before this command can be applied.
Features from more than one usage can be imported. For example, features from both a Harbour and an Aids to Navigation usages can be used to populate a panel. However, data must fall within panel extents.
When creating or updating database charts with panels that have a coordinate reference system (CRS) other than WGS84, the source extraction is converted to WGS84. The Chart Panel Data layers in the Attributes window will show a Source CRS section with CRS details for the source extraction. |
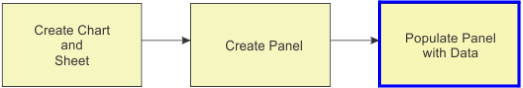
This command is the third step of a three-part process for creating charts and panels. See the graphic below for an overview of the chart creation process.
Related commands:
• • | • |
Procedure
1. Select Boundary layer in the Layers window.
2. Select the Create Panel Data from Source command.
3. [Optional] If you are using multiple usages, select another usage and repeat the Create Panel Data command.
A new Panel layer, is created. This panel holds the features for the chart. The panel name is always Panel [n]. The number is derived from the panel number (PANNUM) attribute. An example of a chart layer with a panel layer is shown below, accompanied by the Source CRS section in the Attributes window.
