The Onboard Control Centre consists of various components based on the current mode of the application. There are two possible modes - Map View and Lite View.
• In Map View mode, the application consists of a web map viewer, configuration and information panels, and various tool buttons for working with the web map viewer.
• In Lite View mode, the application consists of configuration and information panels and a tool for viewing a snapshot of data being processed.
Each of these interface components is described below.
Map View Mode
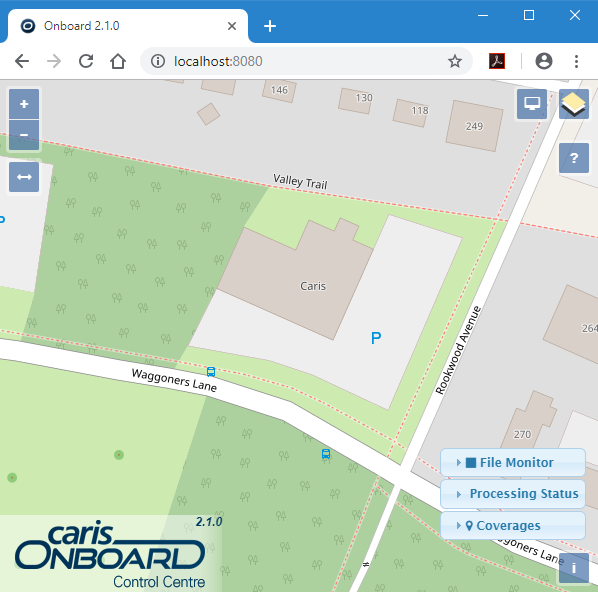
In Map View mode, the interface consists of a web map viewer and various tools. The web map viewer is used to view survey data as it is being processed via the Onboard service. This data can be in the form of a raster coverage or track lines.
It also displays a background map that is either:
• a view of the survey area provided via a connection to OpenStreetMap,
• a base map of the world downloaded from the CARIS Customer Service website.
The area of the base map displayed is controlled by coverage layers defined for each project being monitored. These layers are defined in the Coverages panel. See Defining Coverage Display Settings for more information.
The table below describes the tools available in Map View mode.
Tool | Description |
|---|---|
Zoom In/Zoom Out
| These buttons are used to zoom in or out of the display using a preset zoom percentage each time the button is clicked. 1. Click the Plus button to zoom in or the Minus button to zoom out. 2. Continue clicking the relevant button until the desired view is reached. |
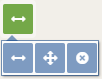
| The Measurement Tools button provides a toolbar with options for measuring distance and area. To use one of these tools: 1. Click the button to activite the functionality. 2. Select the unit of measure to use for the measurement. 3. Click the map view at the point where you want to begin measuring. As you move the mouse in the direction of the next point, note that a dotted line is now trailing the cursor and the measured distance at the current cursor location is displayed. 4. Click to place the second measurement point. A dotted line will be created between the two points. If measuring a line, a label will be added identifying the length of the line segment. 5. Continue clicking until the line or area covers the desired location. Each time that a measurement point is added, a new line segment is added, and a new label is added for the length of the segment for a line. 6. When the last measurement point has been added, click the final point a second time to end the measurement. The line will become a solid line and a label will be added for the total length or area. A new measurement can then be started or the measurement tool can be deactivated by clicking the tool button again or by clicking the X button in the toolbar. 7. Click the Measure Distance and Angle button to collapse the toolbar. |
| This button switches the application from Map View to Lite View. Lite View provides the same configuration and information panels as Map View, but does not provide a live-streaming display of the data as it is processed. Lite View mode is useful for users with bandwidth restrictions. |
| This button provides a list of layers that are available for display in the map view. The list is populated based on the layers defined in the Coverages panel. The layers can be added to or removed from the display by clicking the check box beside each layer. See Defining Coverage Display Settings for more information. |
| This button is used to launch the HTML help provided with the application. The style of button will differ based on the active mode of the application. The help will display in a separate dialog box that can be moved and/or resized. The title bar of this dialog box has buttons to close the dialog box or open the help in a new full size browser tab. |
| This button provides a link to the OpenStreetMap source being used by the application. |
| The File Monitor panel is used to configure the monitoring and processing of data in Onboard. Refer to Configuring Onboard: File Monitor Panel for instructions on how to complete the configurations. |
| The Processing Status panel provides a list of jobs currently being processed by the Onboard service. Until Onboard is configured and a file is available in the Monitor Directory, there will be no jobs listed in the panel.This panel also provides basic and advanced search functionality, which allows both the job list and the database of processed jobs to be searched. Refer to Monitoring Onboard360 for information on this panel. |
| The Coverages panel is used to define display settings for the coverages being generated from the jobs being processed by the Onboard service. These coverages can only be displayed in the map viewer if the necessary settings are defined in the process model and the job files are processing successfully. See Defining Coverage Display Settings for more information on this panel. |
Lite View Mode
In Lite View mode, the interface consists of configuration panels and tools only, it does not provide a live streaming view of the data being processed. This mode is recommended for computers with restricted bandwidth.
The table below describes the tools available in Lite View mode.
Tool | Description |
|---|---|
| The Processing Status panel provides a list of jobs currently being processed by the Onboard service. Until Onboard is configured and a file is available in the Monitor Directory, there will be no jobs listed in the panel. This panel also provides basic and advanced search functionality, which allows both the job list and the database of processed jobs to be searched. Refer to Monitoring Onboard360 for information on this panel. |
| The File Monitor panel is used to configure the monitoring and processing of data in Onboard. Refer to Configuring Onboard: File Monitor Panel for instructions on how to complete the configurations. |
| The Coverages panel is used to define display settings for the coverages being generated from the jobs being processed by the Onboard service. These coverages can only be displayed in the map viewer if the necessary settings are defined in the process model and the job files are processing successfully. See Defining Coverage Display Settings for more information on this panel. |
| This button is used to launch the HTML help provided with the application. The style of button will differ based on the active mode of the application. The help will display in a separate dialog box that can be moved and/or resized. The title bar of this dialog box has buttons to close the dialog box or open the help in a new full size browser tab. |
| This button switches the application from Lite View to Map View. Map View provides the same configuration and information panels as Lite View, as well as a a live-streaming display of the data as it is processed. Map View mode is recommended for users with high bandwidth. |