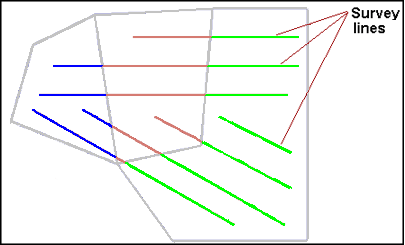
Tide zones and station locations can be viewed in the Display window.
1. Select the Open command.
Menu | File > Open |
A standard Windows Open dialog box is displayed.
2. Navigate to the desired tide zone file (*.zdf) and click Open.
The outlines of the tide zones, and their identification labels are drawn in the Display window. The tide file is listed in the Layers window. (See Tide Zone Files.)
To change the colour of the tide zone outlines and labels:
3. Select the ZDF file in the Layers window.
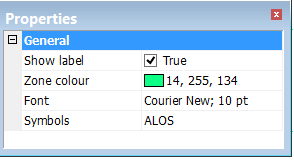
4. Open the Properties window.
5. Set Show label to “False” to hide label, leaving the symbol displayed.
6. Click in the Zone colour field to pick a colour for the outline and label .
7. Change the Font style and size by selecting from the drop-down list.
The Properties for track lines enable you to colour the lines by the tide applied to them.
To colour by tide:
8. Select the track lines layer in the Layers Window.
9. In the Properties window, set the Colour By field to Tide.