
Menu | Tools > Editors > Subset > Open/Close Editor |
Subset Editor can be used to analyze and edit CZMIL point data that has been georeferenced. In this editor, there are 2D and 3D views to provide close-up views of a user-defined subset of data from the open dataset. Refer to Subset Editor for detailed information on this editor.
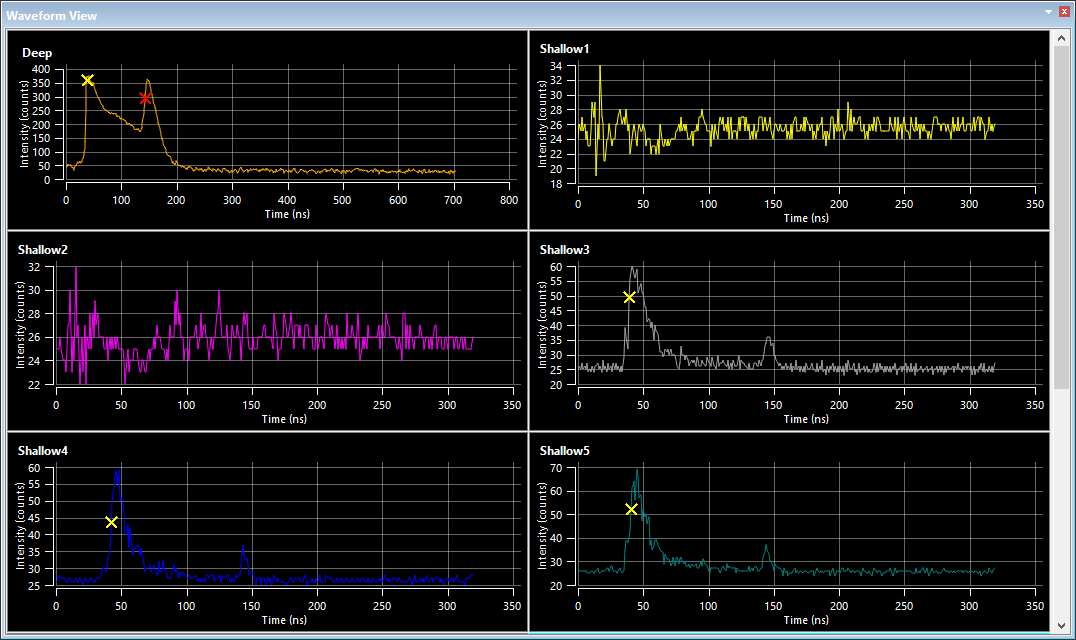
When working with CZMIL data, the Subset Editor also provides a Waveform view. This view provides a tiled view of graphs, which is populated when a subset has been defined and points are selected within the subset. Each graph represents a channel in the data selected within the subset. This data is displayed as the waveform for the superselected point in the channel. On the waveform, returns are represented by Xs on the graph. These Xs are colour coded to identify the return they represent, for example, a yellow X is a water surface return, red is a bathymetric return, green represents the superselected point and grey is anything else.
The graphs in the view are displayed differently depending on the size and location of the window. A single graph is displayed by default and each additional graph can be viewed by scrolling in the window. Expanding the window size will add more graphs to the view both vertically and horizontally. The window can be undocked to maximize the viewing space and see all available graphs.
A Maximize/Minimize toggle button  is available in the top-right corner of each graph when the mouse cursor is positioned in a graph tile. This toggle can be used to automatically expand the graph to fill the available window space or return the graph to the default collapsed size.
When viewing a graph, it is possible to zoom and pan within the data in the same manner as the 2D and 3D views. See Subset Editor Interface for information on navigating within Subset Editor views.
The Properties window also provides controls for viewing waveform data, allowing more than one channel to be displayed within a single graph.

To enable multiple channels in a single graph:
1. Click the graph to make it active, a teal highlight will be added around the active graph.
2. Click the check box of each channel in the Properties window to be included in the graph.
Also provided in the Subset Editor when working with CZMIL data is the Image Preview window. If the CZMIL data directory contains camera images, this window will automatically display the nearest image for the data currently being viewed. As different data areas are examined, the image will change if a nearer image is available.
Procedure
To view CZMIL data in Subset Editor:
1. Open a CZMIL dataset.
2. Select the Open Subset Editor command.
The Subset Editor windows are added to the interface and the cursor changes to allow a subset to be defined.
3. Click and drag in the 2D View display window to create a bounding box around the data to be included in the subset.
The Subset Editor 2D and 3D views will be populated with the points in the subset.
4. Select points within either of the subset views to create a selection.
5. To populate the Waveform view, click a point to superselect it in the Selection window.
Once data is populated in the necessary views, data can be flagged or reprocessed as needed. See Filter CZMIL Points and Reprocess Data As... for more information.