Side scan data is displayed in the Side Scan View window (also called the “waterfall” view). This window can be undocked and moved to another position.
There are two modes to display data in the Side Scan View window:
• Raw: (the unprocessed sonar data). In raw mode the across-track axis represents time, thus the data is shown in the sequence in which it was received. The central portion of the image still displays the water column. This mode will always show the raw data for the selected track line.
• Processed: (the processed sonar data). In processed mode the across-track scale represents distance. The water column is no longer visible as it is removed during the automatic slant range correction. (The data displayed in this mode will reflect the configuration of corrections in the Properties window.)
1. Right-click in the waterfall view to select a display mode.
Menu | Tools > Editors > Side Scan > Raw /Processed |
Pop-up | Raw Processed |
The display is refreshed to show the data in the selected mode. The selected mode is indicated with a check mark in the menu.
If the data does not fill the entire height of the Side Scan View, it will be displayed in the bottom of the window and can be processed normally. The empty area above the data will indicate “No data to display”. |
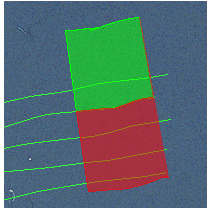
Coverage outline
A coverage outline in the Display window automatically highlights the location of the side scan data that is visible in the View window. Changing the location of the outline changes the data that is displayed in the Side Scan View, and vice versa.
The starboard and port areas of the coverage outline are appropriately colour-coded, as illustrated below.
Colours for outlines and selection are controlled from the Tools >Options >Display > Side Scan Editor dialog box.
You can use the Side Scan Measure Distance and Measure Shadow tools in the View window (see Use Measure tools). When you release the mouse button, the results are shown in the Coordinates window.