The Compute Statistics tool provides statistics on the points/nodes in a band of a coverage.
There are three different commands for computing statistics. The different commands are used to define the area of a coverage to be included in the computation.
• Entire Dataset, which will compute statistics for the entire area of the surface
• By Digitizing, which allows you to digitize a polygon around the area of the surface that will be used to compute statistics, see Digitize for details on digitizing features
• Using Feature Layer, which will compute statistics on a limited area of the surface based on a polygon in a feature layer.
To use the feature layer method, you must have a feature layer open that contains cvrage features, prior to selecting the command. |
The statistics calculated are:
• Minimum
• Maximum
• Mean
• Area
• Std_dev
• Total count
In addition to these basic statistics, a histogram is also provided depicting the number of points/nodes in a range of values using a specified interval.
Interface
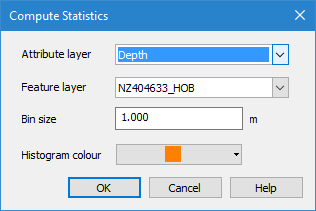
The Compute Statistics command uses the following dialog box.
Option | Description |
Attribute layer | The attribute layer containing the data for which statistics are to be computed. |
Feature layer | The feature layer to be used to limit the area of the surface included in the computations. This option is only enabled if the Using Feature Layer command was used to launch the dialog box. |
Bin size | The size of each column in the histogram; functioning as the interval value for the creation of bins. The unit of measure for the Bin size field is controlled by the selected attribute layer. If the selected layer contains Z values, the field will use the Elevation settings in the Units category of Tools > Options. If the layer does not contain Z values, no unit is specified. |
Histogram colour | The colour that will be used to colour the bins in the histogram for the resulting statistics. |
Procedure: Entire Dataset
Menu | Tools > Coverages > Compute Statistics > Entire Dataset |
Tool |
|
1. Select a coverage in the Layers window.
2. Select the Compute Statistics for Entire Dataset command.
The Compute Statistics dialog box is displayed.
3. Select the Attribute layer for which you want to compute statistics.
4. Enter a Bin size for the histogram.
5. Select a colour from the Histogram colour list.
6. Click OK.
The results are displayed in the Compute Statistics dialog box. See Compute Statistics Results.
Procedure: By Digitizing
Menu | Tools > Coverages > Compute Statistics > By Digitizing |
1. Select a coverage in the Layers window.
2. Select the Compute Statistics by Digitizing command.
The cursor changes to indicate that the application is in Digitize mode.
3. Digitize a coverage (cvrage) area object around the surface area of interest.
4. Right-click and select the Close Area command or press the <End> key to complete the polygon.
Pop-up | Area Digitizer > Close Area |
The Compute Statistics dialog box is displayed.
5. Select the Attribute layer for which you want to compute statistics.
6. Enter a Bin size for the histogram.
7. Select a colour from the Histogram colour list.
8. Click OK.
The results are displayed in the Compute Statistics dialog box. See Compute Statistics Results.
Procedure: Using Feature Layer
Menu | Tools > Coverages > Compute Statistics > By Digitizing |
1. Open a feature layer containing a coverage (cvrage) area object or digitize a cvrage object on the feature layer.
2. Select a coverage in the Layers window.
3. Select the Compute Statistics command.
The Compute Statistics dialog box is displayed.
4. Select the Attribute layer for which you want to compute statistics.
5. Enter a Bin size for the histogram.
6. Select a colour from the Histogram colour list.
7. Click OK.
The results are displayed in the Compute Statistics dialog box. See Compute Statistics Results.
Compute Statistics Results
The statistical analysis of a surface is reported in the Compute Statistics dialog box. 
Option | Description |
Input | The settings that were used to perform the statistics calculation. |
Statistics | The results of the analysis of the data in the selected attribute layer. |
Histogram | A chart view of the analysis results. The X-axis of the histogram provides the bin sizes and their unit of measure. The label for the X-axis is defined by the name of the source layer. The Y-axis provides the count for the points/nodes in each bin. |
Image Export | Export the analysis results to an image format. When exporting to an image format, only the histogram is exported. Because a larger window is available in an image, you will get a more detailed histogram. See Export View for information on the image export procedure. |
ASCII Export | Export the analysis results to an ASCII file. All information will be included in the export. 1. Click ASCII Export. 2. Specify a name and location for the file. 3. Click Save. |
1. Export the results if necessary.
2. Click OK to close the dialog box when finished.
