Menu | Tools > Surfaces > QC Report |
Pop-up | QC Report (Layers window) |
The Surface Quality Control report lists significant data gaps within the surface. It also analyzes how much of your data conforms to the confidence levels set by the S-44 standard for the four orders of survey.
Significant data gaps are known as “holidays”. A holiday is formed when enough gaps are clustered together within a specified radius. A layer can be created which displays these holidays.
See also:
Interface
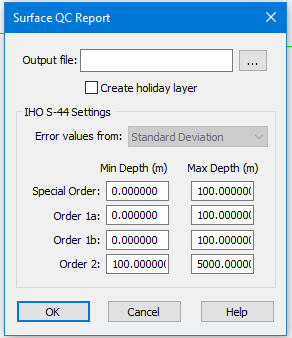
The Surface QC dialog box.
IHO S-44 Settings
Use these settings to compare uncertainty values contained in the surface to the S-44 standard. These values are drawn from the Standard Deviation and Uncertainty layers. This comparison will show how many nodes in the surface fall within the S‑44 categories.
The report is shown in the Output window, and in the Output file you designated. A Depth and Holiday layer is displayed in the Layers window under the other layers for the surface.
Procedure
1. Select the surface parent layer in the Layers window.
2. Select the Surface QC Report command.
The Surface QC Report dialog box is displayed.
1. In the Output file field, click Browse and set a directory path and name for the QC report.
2. To create a layer indicating gaps, select the Create holiday layer check box.
3. Select the source of Error values from the drop-down list:
• Uncertainty layer (which contains the uncertainty “model” values entered when the surface was created),
• Standard Deviation (the values showing how the data varies from the “model”),
• Greater of the two (uncertainty or standard deviation, whichever is larger value)
• Lesser of the two.
For a swath angle surface, the error values come from the Standard Deviation layer only. (The option will be greyed out, but it is applied.) |
4. Enter the minimum and maximum depth levels for each survey order, from the minimum and maximum depths in your surface. (You can have overlapping depth levels.)
5. Click OK.
QC Report File example
Surface QC Report Date and Time: 2/4/2014 3:39:49 PM Surface: C:\Users\usldemo\CARIS\HIPS\90\FundyData\PASG1\Jn317.csar Holiday layer created: Yes Error values from: Standard Deviation
Number of nodes processed: 8859 Number of nodes populated: 8858 (99.99%) Number of holidays detected: 3 IHO S-44 Special Order: Range: 0.000 to 100.000 Number of nodes considered: 8858 Number of nodes within: 2523 (28.48%) Residual mean: 0.743 S-44 Order 1a: Range: 0.000 to 100.000 Number of nodes considered: 8858 Number of nodes within: 3995 (45.10%) Residual mean: 0.473 S-44 Order 1b: Range: 0.000 to 100.000 Number of nodes considered: 8858 Number of nodes within: 3995 (45.10%) Residual mean: 0.473 S-44 Order 2: Range: 100.000 to 5000.000 No depths within the specified range |
Sections of a QC report file
The first section contains information about the report file and the data holiday options set in the dialog box:
• The data and time that the QC report file was created.
• The surface on which the QC report is based
• The minimum number of nodes required to omit a node (without data) from being included in a holiday.
• If a holiday layer was created or not.
• The source of error values (the layer).
The second section contains information on the number of nodes containing data:
• The total number of nodes processed in the surface.
• The total number of nodes that contains data.
• Percentage of the surface that contains data.
• Number of data holidays located.
The third section contains information about each S-44 survey order:
• The depth range for the survey order (set in the dialog box).
• The number of nodes within that depth range with uncertainty values that were considered for the survey order.
• The number of nodes that fall within the depth error limits for that survey order.
• The residual mean is derived from the computed and reported uncertainty.
If the value is negative, the uncertainty values meet the requirements for the selected survey order. If the value is positive, the uncertainty values do not meet the requirements for the selected survey order. Therefore, if no nodes were considered for the survey order, the residual mean would have to be above zero.