![]() CARIS HPD Source Editor
CARIS HPD Source Editor
Menu | Tools > Limits and Boundaries > Envelope of Arcs |
Tool |
|
This command is only available if the Limits and Boundaries module is enabled. See Modules for further information |
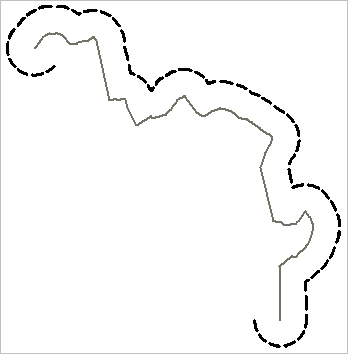
Calculate a limit line at a specified geodetic distance from a baseline. Use the Interactive Baseline and Wagon Wheel Filter commands to create the baseline from an existing coastline or low water line.
Maritime limits can be calculated from normal points or from straight baselines.
Related commands:
• • • • | • • • • |
Interface
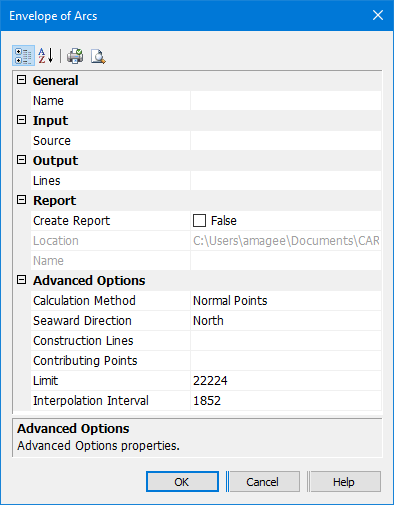
Property | Description |
|---|---|
General | |
Name | The name of the layer that will contain the new line. Select from the list. This can be the same as the source layer. |
Input | |
Source | The input line or lines. By default, the most recently used source, if any, will be selected. Select from the list: • [blank line]: This will clear the text box. • Superselection: The superselected line, if any. This will not be available if no features are selected. • Selection: All selected lines, if any. This will not be available if no features are selected. • [list of layers]: All available layers. All lines in the layer will be used as source lines. It is recommended that you select a layer only if it contains suitable source lines and no other lines, such as a filtered layer that contains only coastlines. |
Output | |
Lines | The feature acronym and attributes of the output line. By default, the most recently used acronym, if any, will be selected. Type an acronym or select from the list: • [blank line]: This will clear the text box. • [recent objects]: A list of any recently used objects. • Templates: Displays the Select Template dialog box. See “Using Templates with Limits and Boundaries” on page 33 for details. • Objects: Displays the Select Object dialog box. Select an acronym from the list of Feature Acronyms then define the attributes. |
Report | |
Create Report | Output points to a text file: • False: No report file will be created. • True: Generate a report. The report lists the start and end points of each arc along with the contributing points. The Location and Name properties become active. |
Location | Accept the default or click browse (...) to select a location for the report. |
Name | Type a name for the report. |
Advanced Options | |
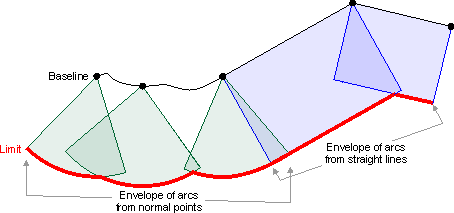
Calculation Method | Select from: • Normal Points: Use this if the baseline is formed of normal baseline points. The data is always interpreted as points, even if you select a line. Only the vertices of the lines will be considered. • Straight Lines: Use this if the baseline is represented by straight lines. The line data is always interpreted as connected geodesics. The geodesic segments between the turning points of the baseline as well as these turning points are used in the calculation. |
Seaward Direction | The direction from the baseline where the arcs are to be drawn. Select from north, south, east or west. An arrow is displayed on the map to indicate the direction. |
Construction Lines | Draw the construction lines joining the end points of arcs on the limit line to their contributing points on the baseline. Type an acronym directly or select from the list. Type an acronym or select from the list: • [blank line]: This will clear the text box. • [recent objects]: A list of any recently used objects. • Templates: Displays the Select Template dialog box. See “Using Templates with Limits and Boundaries” on page 33 for details. • Objects: Displays the Select Object dialog box. Select an acronym from the list of Feature Acronyms then define the attributes. |
Contributing Points | Mark the contributing points with a symbol. Set the acronym and attributes of the symbol. Type an acronym directly or select from the list. • [blank line]: This will clear the text box. • [recent objects]: A list of any recently used objects. • Templates: Displays the Select Template dialog box. See “Using Templates with Limits and Boundaries” on page 33 for details. • Objects: Displays the Select Object dialog box. Select an acronym from the list of Feature Acronyms then define the attributes. |
Limit | The geodetic distance of the limit being calculated. Units are taken from the Options settings. |
Interpolation Interval | The interval between points on the output line. Type a value. When the value is 0, the interpolation interval value along the arc is automatically calculated as follows: • Up to 60 nautical miles: ~1/60th of the value of the limit distance • At and beyond 60 M: 1 nautical mile Units are based on the options settings. |
Toolbar:
Icon | Description |
|---|---|
| Categorized. Display the properties in their categories. |
| Alphabetical. Display the properties in alphabetical order. |
| Quick print. Prints the current settings of the dialog box. Displays a Print dialog box. |
| Print Preview. Displays the current settings of the dialog box. |
Procedure
1. Select the Envelope of Arcs command.
The Envelope of Arcs dialog box is displayed.Set any necessary options.
2. Click OK.
The limit line is drawn.