![]() CARIS HPD Paper Chart Editor
CARIS HPD Paper Chart Editor
![]() CARIS Paper Chart Composer
CARIS Paper Chart Composer
Menu | Create > Legend |
Add a legend to chart.
Legends are tables that list classification colours. Classifications are used to colour-code features using attribute values.
For example, depth contours can be colour-coded using Value of Depth Contour (VALDCO) attributes. The Create Legend command will create a table of colours from the depth-contours classification.
A classification must exist before the Legend command can be applied.
Related commands:
• • • • | • • • |
Interface
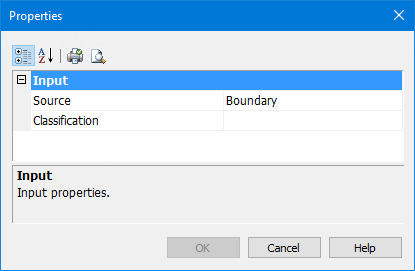
Property | Description |
|---|---|
Source | A list of available panel data layers. |
Classification | A list of available classifications for the legend. |
Procedure
1. In the Layers window, select the Panel data layer.
2. Select the Create Legend command.
The Properties dialog box is displayed.
3. Select the Panel data layer for the legend.
4. Select an available classification.
5. Click OK.
The mouse pointer changes ( ).
).
6. Click at the top left of the area where you want to place the legend.
The legend is added below and to the right of the pointer.
You can now move and resize the legend if necessary.