The HIPS Data node provides properties for sounding selection and some display settings.
HIPS Data Properties | Description |
|---|---|
Colours | In the Subset Editor View, attributes of data can be identified visually by assigning colours to different attribute values.
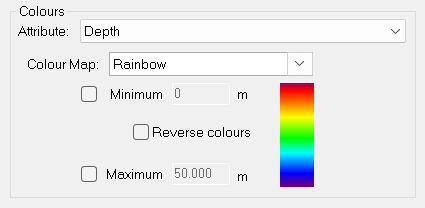
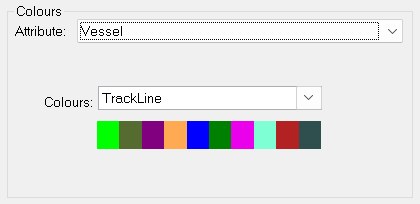
The data can be coloured by any of the following attributes: • Depth • Depth Uncertainty • Position Uncertainty • IHO S-44 • IHO S-57 • Project • Vessel • Day • Line • Amplitude • Detection Method • Detection Type • Transducer • Confidence • Multiple Frequencies Attributes that are based on a range of values (such as Depth and Depth Uncertainty) are coloured using a colour map, as shown in the screenshot above. If a specific range of values is not set for the attribute, it is automatically read from the subset. • The colour at the top end of the selected map will be used for the Minimum value (and all values less than the Minimum value). • The colour at the bottom of the map will be used for the Maximum value (and all values greater than the Maximum value). • The colours between the top and the bottom will be used for the values between the Minimum and Maximum. • The Reverse Colours check box turns the colour map upside-down so that the top colour becomes the bottom colour and vice versa. Attributes that are based on a set of unnamed values (such as Project and Vessel) are also coloured using a colour map. However, in this case there are no Minimum or Maximum options because each value is simply assigned the next colour defined in the colour map sequentially.
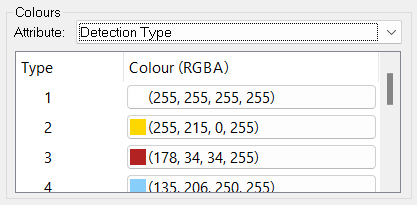
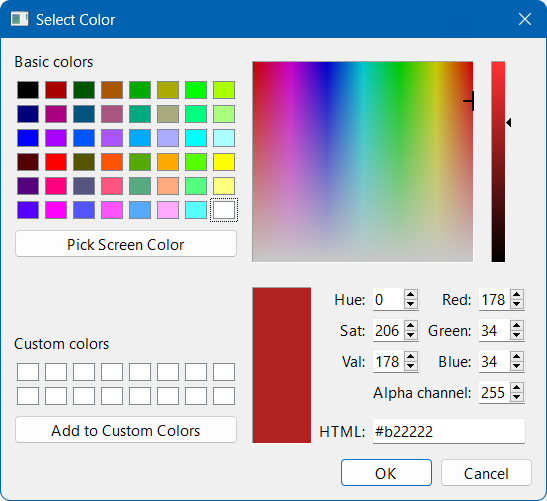
Attributes that are based on a set of named values (such as Detection Type and Multiple Frequencies) have a specific colour for each value. These default colours can be changed by selecting a colour in the widget and choosing another colour from the colour picker.
|
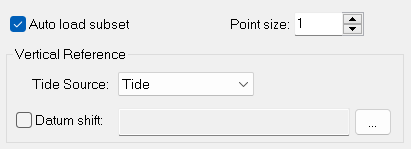
Auto load subset | The Auto Load Subset control will automatically load subset data in the 3-D and 2-D Views when a subset area is created or changed.
The value set in the Point size field controls the size of the points in the 2D and 3D views. The value can be set between 1 and 10. |
Vertical Reference | Data can be shifted vertically using either a tide or a currently open surface to visually change the data in the display. (No changes are made to the stored data.) Use Tide Source to generate final depths relative to a tide datum by subtracting the tide values from the sounding depth. Use an open surface or an open XYZ file to shift using a grid of datum heights. 1. Select the Datum Shift check box and click Browse to open the Select Surface dialog box. 2. Select a surface to use from the list of open surfaces. Click OK. |
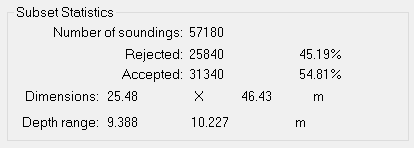
Subset Statistics
| Each time a subset is generated, the following information is displayed: • total soundings in the current subset • number and percentage of soundings with Accepted and Rejected status • dimensions of the subset • minimum and maximum depth levels within the range of the subset.
|