An example of a report table: 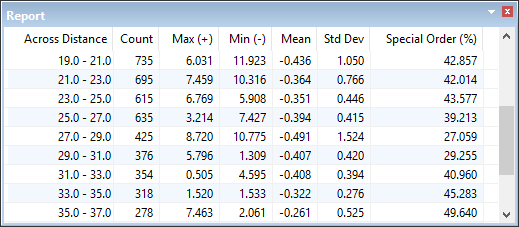
The quality control report is displayed in the Report window.
Field | Definition |
|---|---|
Grouping method (identified in the first column of the report table. | The field displays the Range grouping as defined in the third dialog box in the wizard. • Beam number: Soundings are grouped according to across-track beam number. • Angle: Soundings are grouped according to beam angle from nadir. • Distance: Soundings are grouped according to across-track distance from nadir. |
Count | Total soundings in range. |
Max | Maximum distance of soundings above surface. |
Min | Maximum distance of soundings below surface. |
Mean | Mean difference of soundings to surface. |
Std Dev | Standard deviation of mean differences is presented at one sigma or 68% Confidence Interval. |
(Selected S-44 or S-57 categories) | Percentage of soundings that fall within the selected S-44 survey orders or S-57 CATZOC zones of confidence categories. |
An example of a report table: