Raster charting combines a database chart in PCE with a set of high-resolution monochrome TIFF or RLE images. These files are opened as layers with each layer representing a single colour (similar to traditional film separates). Raster layers are grouped in a raster set.
Raster functionality is enabled by a license extension to regular HPD paper chart functionality. |
Why Raster Charting?
Raster charting serves two purposes:
• Production of new charts and new editions of charts already containing colour-separated raster images (e.g. a chart series adopted from another agency).
• Maintenance of a currently published version of a chart for Notices to Mariners, so that the chart can be printed on demand or exported to a digital format.
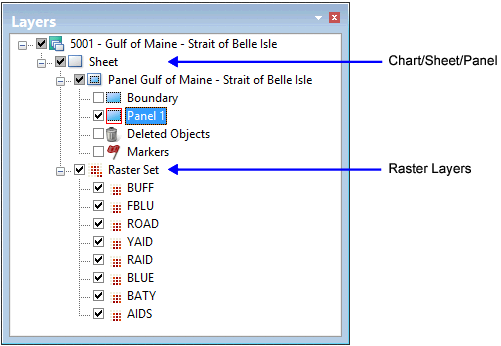
An example of a chart with a raster set in the Layers window is shown below.
Raster chart functionality includes the following operations:
• Management of monochrome raster layers (add, resize, delete)
• Registration (geo-referencing) of some or all raster layers, e.g. to correct distortions in the raster image
• Editing of raster layers directly, e.g. via brush and eraser, and using operations on selections
• Displaying raster and vector seamlessly together
• Applying (“burning”) vector features to the Raster Set
• Comparing an updated Raster Set against other raster layers, e.g., for verification
• Exporting charts that include a Raster Set, whether for printing or as a digital product in a different format.
Portrayal
A Raster Set is a group of monochrome image layers that when opened together display a chart.
For example, the chart area shown below is comprised of separate raster layers.

Land areas are represented on one layer, text and soundings on a separate layer, depth contours on another layer, etc.
Raster portrayal is controlled by three components:
• Raster layers file
• Chart portrayal file and identifier
• Colour map.
How these files interact to display raster data is shown below.

The Chart Presentation Identifier (chprid) is a chart attribute that references a portrayal style. The Chart Presentation Identifiers for raster charting are INT1 or INT1-v2.0 (if applying Raster Dynamic Masking).
A portrayal style points to a set of support files for displaying data in PCE. The support files are listed in a Portrayal Control File.
The Raster Layers file (RasterLayers.txt) in ..\System\PCEConfig contains a layer code and colour token for each raster image:
BUFF Land_Area |
HBLU Depth_Area_Med_Shallow |
FBLU Depth_Area_Shallow |
DRYG Intertidal_Area |
TOWN Built_Up_Area |
ROAD Grey_20p |
TRAF Traffic_Separation_Magenta |
GAID Green |
YAID Yellow |
RAID Red |
BLUE Blue |
BATY Bathymetric_Contour |
AIDS Nautical_Purple |
BLPN Black |
For example, BUFF is the layer code and Land_Area is the colour token. The colour token must be listed in a colour file that is associated with the Portrayal Control File.
The order of entries determines the draw order of layers. In the above example, the BUFF layer is drawn first and the BLPN layer is drawn last. This means that the BLPN layer is foremost in display priority while BUFF has the least display priority.
A custom raster layers file with a custom portrayal style can be created for raster charts. For more information on these files, see Portrayal.