![]() CARIS HPD Source Editor
CARIS HPD Source Editor
Tool |
|
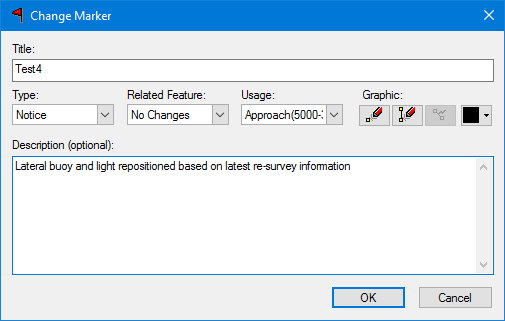
Pop-up | Change Marker (Markers window) |
Change text, attach new or additional features, redefine points or line graphics in a selected marker. If the marker has an existing reply, only the reply can be changed.
You must have a Marker Editor role.
Available only from the Markers window.
Related commands:
• • • • • • • • • | • • • • • • • • |
Interface: Change
Option | Description |
|---|---|
Title | The name of the marker. Type a name or edit the existing name. |
Type | The type of marker. Select from the list. |
Related Feature | If the marker is related to one or more selected features, choose from the list: • • • • |
Usage | Select from the list. |
Description | Additional information. Type in the text box. |
Graphic | A graphic can be one of the following: • Point: a single point for the marker. • Line: a line boundary for the area of the marker. Digitize a point graphic. 1. Select the Digitize Point Graphic tool. ( The Create Marker dialog box closes. 2. Click within the map. The Create Marker dialog box reopens. Digitize a line graphic. 1. Select the Digitize Line Graphic tool. ( The Create Marker dialog box closes. 2. Click multiple times within the map to place the vertices of the line. 3. End the line. End a line using the pop-up menu (Edit Line > Close or Edit Line > End) or by pressing <Enter>, <End>, or <Home>. The Create Marker dialog box reopens. Select a colour for the graphic. 1. Select a colour from the colour picker. ( Reset the graphic. Reset removes the existing graphic to let you add a new one. 1. Select the Reset Graphic tool. ( |
Interface: Reply

Option | Description |
|---|---|
Description | Information to describe the marker and the changes made to it. |
Graphic | A graphic can be one of the following: • Point: a single point for the marker. • Line: a line boundary for the area of the marker. Digitize a point graphic. 1. Select the Digitize Point Graphic tool. ( The Create Marker dialog box closes. 2. Click within the map. The Create Marker dialog box reopens. Digitize a line graphic. 1. Select the Digitize Line Graphic tool. ( The Create Marker dialog box closes. 2. Click multiple times within the map to place the vertices of the line. 3. End the line. End a line using the pop-up menu (Edit Line > Close or Edit Line > End) or by pressing <Enter>, <End>, or <Home>. The Create Marker dialog box reopens. Select a colour for the graphic. 1. Select a colour from the colour picker. ( Reset the graphic. Reset removes the existing graphic to let you add a new one. 1. Select the Reset Graphic tool. ( |
Related Features | Add or remove related features. 1. Select from the list: • No Changes: Keep the marker properties as is. • Replace with Selection: Replace a feature (or features) associated with a marker with selected features. • Add to Selection: Append additional features to a marker. |
Procedure
1. Select a marker in the Markers window.
2. Select the Change Marker command.
If the selected marker has a reply, the Change Reply to Marker dialog box is displayed. Otherwise the Change Marker dialog box is displayed.
3. Make any necessary changes.
4. Click OK.
You are returned to the Markers window.

 )
) )
) )
) )
)