Menu | Edit > Lidar > View Waveform |
Pop-up | View Waveform |
Tool |
|
Menu | Edit > Lidar > View Waveform |
Pop-up | View Waveform |
Tool |
|
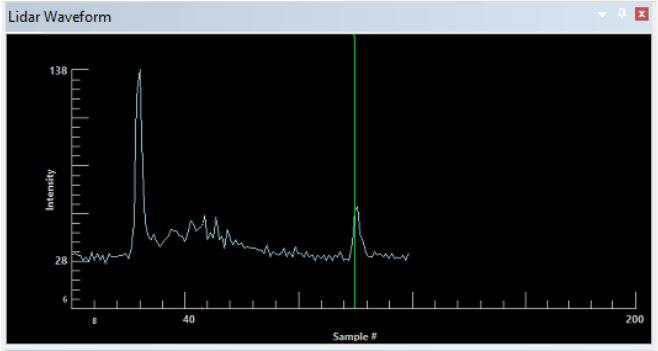
The Waveform view displays the waveform data for a super-selected sounding. The display in the Waveform view is determined by the data format being viewed.
The first sounding in the selection (i.e. with the lowest beam and profile number) is superselected when the Waveforms window is opened.
LAS / LADS
The waveform window contains one panel that shows a graph of specific waveform data for the superselected sounding. One line represents the detected depth sounding and the other line represents the alternative depth sounding (if applicable)
SHOALS
There are four panels in the waveform view for SHOALS data. Each panel shows a graph of specific waveform data for the superselected sounding. The X axis represents time and Y axis represents amplitude.
Procedure
1. Select lidar data in any of the Swath Editor or Subset Editor views. Nothing is visible in the Waveforms window until data is selected.
2. Select a View Waveform command.
.
The Lidar waveform window is displayed.
To view the complete waveform for SHOALS data, the Y-axis scale may have to be increased. The default value is 255.
3. Click the Max Y-Axis Value up or down arrow buttons until the entire wave form is within view.
Point display
The points that describe the waveform graphs can be increased or decreased.
1. Select the Lidar tab in the Control window if it is not already displayed.
2. Click the Point Size up and down arrow buttons.
As the value changes, the displays in the four views are redrawn to show the points at the selected size.
3. To draw a line through the points in the view, select the
Connect Points check box.
