Pop-up | feature layer > Add Layer(s) > Classification |
The Classification command is used to create new filter layers based on the values of a specific attribute in a data source. Layers are automatically generated based on the selected classification type and user-specified interval. The resulting layers are named according to the attribute being classified and the attributes values in each layer. All layers generated for the classification will be added under a group in the Layers window.
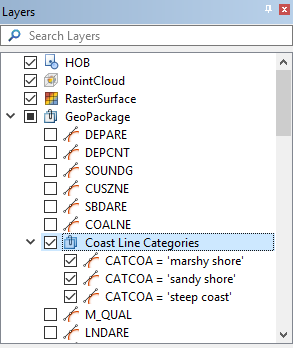
In the example below, classification was run on the COALNE (coastline) layer, using the Number of Values classification type, the category of coastline (CATCOA) attribute and an interval of 1. This results in a separate layer for each coastline type found in the data source. Each individual layer will contain all COALNE features in the category indicated by the layer name, such as the “marshy shore” category.
The Display fields can be used to define a portrayal to control the display of the data in each of the layers. This allows data values to be quickly identified in the view based on the colour and pattern applied to the objects.
This tool is also used when defining the Style property for an existing layer.
The Classification functionality can be used with data in several vector formats, such Shapefiles, GML, GeoPackage, AutoCAD and CARIS DES. It also works with database object layers. It is not currently compatible with HOB and S-57 ENC data.
Related commands:
• Filter
• Style
Interface
The Classification command uses the following dialog box.
Option | Description | |
|---|---|---|
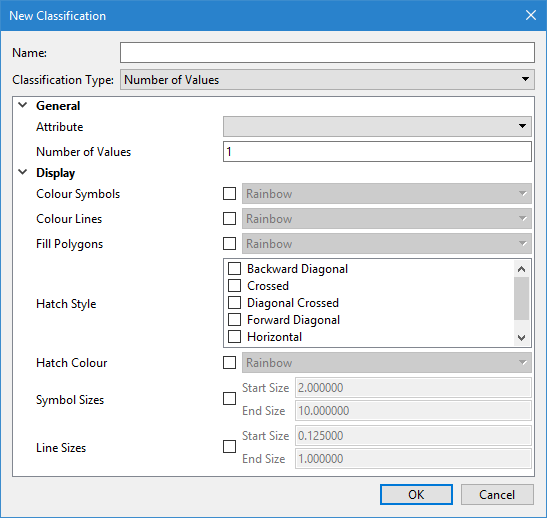
Name | The name to assign to the new group that will be created to contain the classification layers. | |
Classification Type | The type of classification rule to apply. The options are: • Number of values: This option is used to create a classification layer for each set number of values in the data source. A value of 1 is generally used to achieve a unique classification for each value in the data. This option is suitable for attributes that have values in string, enumerated list, or integer format. • Equal interval: This option is used to create a classification layer for every value interval, for example, every 10m. This option is suitable for numeric values. • Defined Interval: This option is used to create a set number of classifications. The interval is calculated based on the number of resulting classifications desired and the range of the data. This option is suitable for numeric values. | |
General | Attribute | The attribute for which to create classifications. The options available are controlled by the catalogue of the layer for which classifications are being created. |
Number of Values/Interval Size/Number of Classes | The interval at which to create classifications. The name of this field will change based on the selected Classification Type. | |
Display | Colour Symbols | The colour map to apply to the display of symbols in each of the classifiction layers. 1. Click the check box to enable the option. 2. Select an option from the drop-down list. |
Colour Lines | The colour map to apply to the display of lines in each of the classification layers. 1. Click the check box to enable the option. 2. Select an option from the drop-down list. | |
Fill Polygons | The colour map to apply to the display of polygons in each of the classification layers. 1. Click the check box to enable the option. 2. Select an option from the drop-down list. | |
Hatch Style | The hatch style to apply to the objects in the classification layers. 1. Click the check box of each hatch style to be applied. | |
Hatch Colour | The colour map to use when colouring hatch styles in the display for each of the classification layers. 1. Click the check box to enable the option. 2. Select an option from the drop-down list. | |
Symbol Sizes | The range of symbol sizes to be coloured according to the colour map file selected for symbols. 1. Click the check box to enable the option. 2. Enter the Start Size in millimetres at display scale. 3. Enter the End Size in millimetres at display scale. | |
Line Sizes | The range of line sizes to be coloured according to the colour map file selected for lines. 1. Click the check box to enable the option. 2. Enter the Start Size in millimetres at display scale. 3. Enter the End Size in millimetres at display scale. | |
Procedure
1. Right-click the layer for which you want to create classification layers.
2. Enter a Name for the Layers window group that will be created to contain the classification layers.
3. Select the Classification Type.
4. Select the Attribute to classify by.
5. Specify the interval for the attribute value classification rules.
6. Define any necessary portrayal options.
7. Click OK.
A new group is added to the Layers window containing the resulting classification layers. Each layer will be named according to the classification rule and the attributes values collected in each layer.