
Tool | CZMIL > QC - Compare CPF to Control Points (Tools window) |
The QC - Compare CPF to Control Points process is used to compare CZMIL CPF data to reference data to analyze how closely the CZMIL data matches the known data. The process begins by downsampling LAS or CSAR point data to create a file of control points in the area of the CZMIL data. Analysis of the CZMIL data near the control points then creates representative scatterplots of the variations between the CZMIL data and the reference data. The variations are reported as an ASCII file in TXT format in the CPF lidar folder. The file will be named according to the current date and time appended with "comparetoreference" (e.g., 20210930T151600_comparetoreference.txt).
CARIS Batch process: Compare CZMIL to Reference
Interface
The options in this process model include:
Option | Description |
|---|---|
Processed CZMIL CPF File | The CZMIL CPF data to be compared against the reference points. 1. Click the browse button (...) to launch the Open File dialog box. 2. Navigate to the relevant CPF file and click Open. |
Reference Point Cloud | The point cloud to be used as a reference source. This can be a point cloud in either CSAR or LAS format. 1. Click the browse button (...) to launch the Open File dialog box. 2. Navigate to the relevant point cloud file and click Open. |
LAS Reference Week | The timestamp indicating the reference week for GPS Week Time. This setting is only needed if an LAS file has been specified as the reference data. 1. Click the check box to enable the option. 2. Click the drop-down arrow to display a calendar tool. 3. Select the relevant date from the calendar. |
Target Number of Points for Analysis | The number of reference points to be considered in the analysis. Any points that are far from all reference points are ignored. |
Filter Based on Minimum Depth | Enable this option to filter out input points shallower than the minimum depth specified. This allows excluding points in very shallow water where noise and variation is higher. |
Minimum Depth | The minimum depth for an input point to be considered. |
Maximum Distance from a Reference Point | The maximum distance from a reference point to the input point for the input point to be relevant. Any points that are farther from all reference points are excluded from the analysis. 1. Type a value in the field and select a unit of measure. |
Maximum Z Difference from Reference Point | The maximum depth difference between the input points and the reference points. If input point depth minus reference point depth is greater than the range specified, the point is filtered out. 1. Type a value in the Vertical Tolerance Filter Maximum field and select a unit of measure. 2. Type a value in the Vertical Tolerance Filter Minimum field and select a unit of measure. |
X Axis | The range of depth values to be displayed along the X axis of the scatterplots. 1. Type the Maximum and Minimum values to be displayed and select the unit of measure for each value. |
Y Axis | The range of difference of depths from the reference values to be displayed along the Y axis of the scatterplots. 1. Type the Maximum and Minimum depth difference values to be displayed and select the unit of measure for each value. |
Shallow Channel | Generate an image file for the scatterplot of variations in the shallow channel data. 1. Click the check box to enable the option. 2. Click the browse button (...) to launch the Save File dialog box. 3. Navigate to the location to store the image files. 4. Click Save. |
Deep Channel | Generate an image file for the scatterplot of variations in the deep channel data. 1. Click the check box to enable the option. 2. Click the browse button (...) to launch the Save File dialog box. 3. Navigate to the location to store the image files. 4. Click Save. |
Log Process Information | Create a log file containing the options specified when the process was run. The location of the log file is determined by the Logs setting in Tools > Options > Files and Folders. 1. Click the check box to enable this option. |
Procedure
1. Double-click the QC - Compare CPF to Control Points process model in the Tools window.
The Run Process Model dialog box is displayed, populated with the Compare CPF to Control Points process model.
2. Navigate to the CZMIL CPF file containing the data to be analyzed.
3. Navigate to the Reference Point Cloud file to be used for the comparison.
4. Define any other necessary options.
5. Click OK.
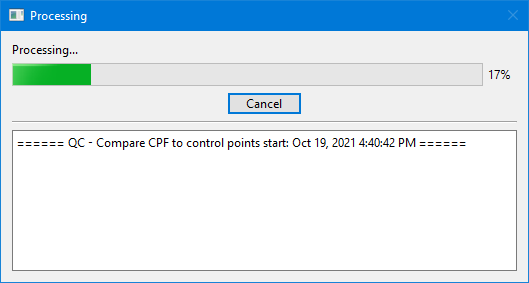
A dialog box is displayed providing progress information as the comparison is run. Similar information is also reported in the Output window.
6. When finished, click the Close button to close the dialog box and complete the process.