Menu | Tools > Report > Generate Statistics |
Generate a report of statistical information on the features in the selected layer. Statistics can be generated based on:
• feature types
• attributes of the features in the source layer
• area measurements of polygons on the source layer
The resulting statistics are reported in the dialog box and can be saved to a comma-separated value (.csv) file if desired.
Interface
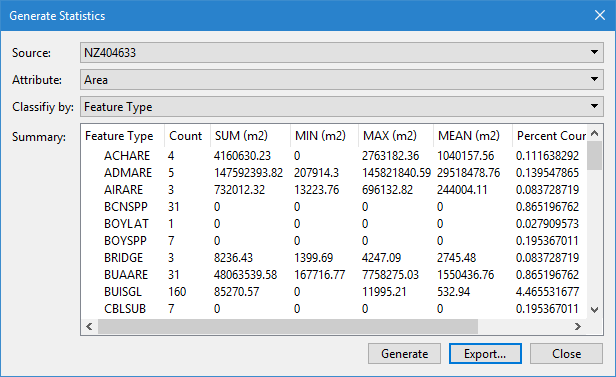
The Generate Statistics command uses the following dialog box.
Option | Description |
|---|---|
Source | The layer containing the data to be analyzed. The drop-down list is populated with all vector data layers currently open in the application. The list will be empty if there are no data sources in a supported format open in the application. Changing the Source after defining other options will cause those options to be reset to (None). |
Attribute | The attribute used to calculate statistics. The drop-down list is populated with common attributes. For some formats, this will include the attributes that are common to all features on the layer, for other formats this will include the attributes that are common to all features in the catalogue of the data source for the layer. Alternatively, the statistics can be calculated based on feature type or the area measurement of the features. |
Classify by | The attribute used to group data into bins in the resulting statistics. The data can be classified by feature type or by common attributes. A new row (bin) is added to the results for each unique value found for the selected attribute. If features are found that have no value or that have a value of UNKNOWN, NULL or UNDEFINED, they will be reported in a separate row called (No Value). If this option is set to (None), all results will be reported in a single row with no binning applied. |
Summary | The summary of the statistics generated according to the selected values, in the form of a table. This area will be blank until the Generate button is clicked. Resetting any of the options in the dialog box will also reset the summary, clearing all statistics. The rows in the table include: • a row for each classification value, if an attribute was selected for Classify by, otherwise the information will all be provided in a single row • a Total row that contains the totals for the values in each reported column The columns in the table include: • <classifiication>: the attribute being used to bin the data when Classify by is set to something other than (None) • Count: the number of items in each bin • SUM: the sum of all items in each bin • MIN: the minimum value of the items in each bin • MAX: the maximum value of the items in each bin • MEAN: the average value of the items in each bin • Percent: the percentage of the data in the layer that is represented by the data in each bin. • Percent Count: the percentage of the total feature count in the layer that is represented by the features in each bin. The values in the table are controlled by the units and precision settings in Tools > Options > Units. If the attribute being calculated has a text value, SUM, MIN, MAX, MEAN and Percent will be populated as 0 or NaN. |
Generate | Generate statistics for the selected layer according to the user-specified settings and populate them in the Summary field. A warning message will be displayed if the selected source layer does not contain any feature objects. |
Export | Export the table of statistical values to a csv file, which can be opened in a text editor or spreadsheet application. The column headings are included as the first row in the file, which a comma separating each column. The values in each row are encased in quotation marks (" "). |
Procedure
1. Select the Generate Statistics command.
The Generate Statistics dialog box is displayed.
2. Select the Source data for the statistics.
3. Select the Attribute to use for calculating the statistics.
4. Select the attribute by which to Classify and bin the data.
5. Click Generate.
Statistics are calculated and displayed in the Summary field.