Tool |
|
There are various tools in the 3D view that let you adjust the display of data.
Vertical Exaggeration
Tool |
|
Set the vertical exaggeration of the depth values. This provides a more detailed view of the features. This tool is provided in the 3D View toolbar, which is located in the top-right corner of the view when turned on. The toolbar can be turned on or off using the Toolbar option in the 3D options of the Display category in Tools > Options.
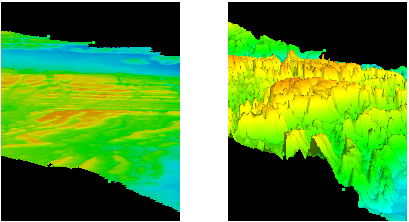
The exaggeration scale is logarithmic — each mark on the scale is the previous mark multiplied by 10.
1. Click the Vertical Exaggeration tool.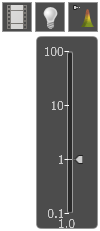
A slider is displayed.
2. Drag the arrow on the slider to the desired scale.
The display is changed as you move the arrow.
3. Release the mouse button.
4. Click the Vertical Exaggeration tool a second time to close the control.
Lighting
Tool |
|
Control the position and angle of the light to add shading. The lighting tool is also provided in the 3D View toolbar.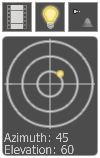
1. Click the Light Control button.
The light source is represented by a yellow dot inside the circle.
The azimuth of the light source is measured from 0º to 360º in a clockwise direction with 0º at the top. Elevation is measured from 0º to 90º, starting from the middle of the dial.
2. Click and drag the yellow dot.
As you drag, the lighting of the data changes and the displayed azimuth and elevation are updated.
3. Release the mouse button when the data has the proper lighting.
4. Click the Lighting tool a second time to close the control.
Colour Legend
Display a colour legend that identifies the colours and the values they represent. The legend can also be used to make quick adjustments to the colour range.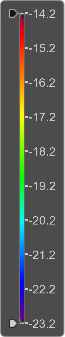
The legend is displayed automatically when an elevation layer is turned on and selected in the Layers window. The values in the legend are updated if a different layer is selected. The automatic display of the legend can be turned on or off using the Colour Legend option in the 3D options in Tools > Options.
1. Turn on an elevation layer in the Layers window.
2. Select the layer, if not already selected.
The colour legend is displayed along the left side of the view. The arrows on the side of the legend represent the minimum and maximum values of the colour range.
To set the minimum value:
1. Select the arrow at the top of the legend.
2. Drag the arrow to the desired value.
To set the maximum value:
1. Select the arrow at the bottom of the legend.
2. Drag the arrow to the desired value.
The colours in the display change as you drag.
To reverse the colours:
1. Drag one arrow past the opposite arrow.
2. Adjust the opposite arrow as needed.

