You can adjust the display of graphical data: colours, display of data points and tools tips.
1. Select the Options command.
Menu | Tools > Options |
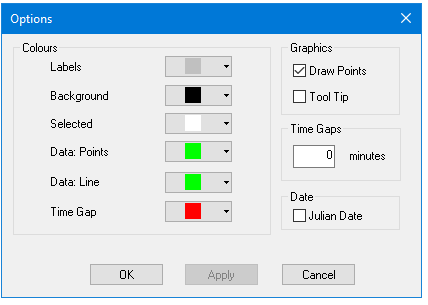
The Options dialog box is displayed.
|
|
Colours | Colours identify display elements, for example, to differentiate data Points from the data Line. Select a colour from the drop-down colour palettes, or create a custom colour from the Windows colour picker. |
Draw Points . | Tide data displays as a line graph made up of points. Clear the check box to turn off the display of points in the graph. |
Tool Tip | A label that displays a specific tide level on the graph, when the cursor is positioned over it. Select the check box to enable these. |
Time Gap | Search for gaps in the tidal time series caused by occasional outages when recording tidal heights. When the interval (in minutes) between adjacent data points is the same as, or greater than the Time Gaps value set here, the data points adjacent to the gap are highlighted. Use the Next Time Gap command to search for these gaps. See Search time gaps. |
Date | The date in tide file table is displayed by default in regular calendar format.
Select the Julian Date box to use Julian date. |