
The Douglas-Peucker algorithm is used to determine the amount of processing required on a feature when filtering or smoothing. The algorithm begins by creating a “trend” line drawn between. the two end vertices.
A tolerance value determines the amount of processing done on the line. The larger the tolerance, the fewer resulting points.
The algorithm begins by creating a straight line (AB) between the two end points. This indicates the trend of the original line.
The maximum deviation from the original line to the trend line is calculated (FG).
The maximum deviation is greater than the tolerance, so two new trend lines (AG and GB) are drawn.
The maximum deviations (HI and JK) from the new trend lines are calculated and compared to the tolerance.

The maximum deviation (HI) from trend line AG is less than the tolerance, so trend line AG replaces the original line segment.
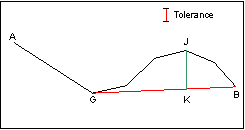
Maximum deviation JK is longer than the tolerance, so two more trend lines are drawn (GJ and JB) and maximum deviations (CD and MN) are calculated.
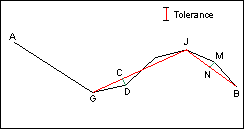
Both CD and MN are shorter than the tolerance, so the trend lines replace the original line segments.
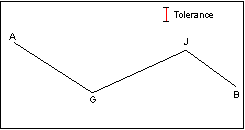
The resulting line is shown in the image below.
If a tolerance of 0 is used, only nodes along a straight line are removed. This means that if you have a straight line with three nodes (start, end, and middle), the middle node is removed since it does not change the shape of the line and removing it makes the dataset more efficient.