Light detection and ranging (Lidar) uses laser technology to measure bathymetry. In such surveys, laser wavelengths are transmitted to the water from a transceiver mounted on a plane or helicopter. Sounding data is returned to the transceiver in a continuous stream that forms a swath-like pattern.
These Lidar formats can be processed in HIPS:
• LADS (*.caf)
• LAS (*.las)
• SHOALS (*.out,*.hof, *.tof).
Lidar data can be processed in either Swath Editor or Subset Editor, depending on how you want to view the data.
If you use Subset Editor, the data can be viewed with the 2D and 3D view and in the waveform viewer, and the cleaning progress can be tracked using the Subset Tile function.
If editing in Swath Editor, a Lidar properties and waveform view are available.
Related Commands:
Interface
Properties and controls for Lidar data are located in the controls window in both Swath and Subset Editor:
• In Subset Editor, the Lidar properties and options are displayed in the Lidar layer of the Subset Control window.
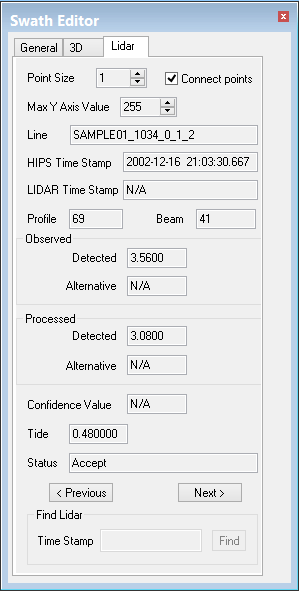
• In Swath Editor the controls are available on a tabbed page of the Swath Editor control window. See example below.
To display the Lidar controls:
1. Open Lidar data in either editor.
2. Select the View Lidar Waveform command.
This will open display the waveform window and display the Lidar controls. The example below shows Lidar controls in Swath Editor.
To display the Lidar controls in Subset Editor:
1. Open Subset Editor and load a subset of the Lidar data.
2. Highlight the Lidar layer in the data tree on the Subset Editor control window.
3. Select the View Waveform command.
The Subset Control window displays the properties of the Lidar data.
Properties
The following properties for the selected sounding are displayed in the Lidar tab in both editors:
Options | Description |
|---|---|
Point Size | Change the size of the points that describe the waveform graphs. |
Connect Points | Select this option to draw a line through each of the points in the graph. |
Max Y Axis Value | Change the scale of the Y axis to display less or more of the waveform. |
Line | Identifies the superselected line. |
HIPS Time Stamp | Year-Month-Day-Hour-Minute-Seconds-Milliseconds. |
Lidar Time Stamp | Half milliseconds since midnight (SHOALS only). Microseconds (Hawkeye data). |
Profile (number) | The along-track position of the sounding. |
Beam (number) | The across-track position of the sounding. |
Observed / Processed | Fields display the sounding values when converted to HIPS format. If any processing (such as tide) is applied to the Observed data the new value will be displayed in the Processed fields. |
Detected | The value designated by the acquisition system as being the sounding depth. If a Detected depth is selected, an asterisk is displayed beside the field. |
Alternative | If the data includes an alternative depth value from the return, it will be displayed here. If you select an alternative depth, an asterisk is displayed beside the field. (SeeSelecting Detected and Alternative Data. Note: Not all Hawkeye data contain alternate depths that can be highlighted or swapped with the primary depths. |
Confidence value | The confidence value for the sounding (SHOALS only). |
Tide | Tide data for the sounding, if there is any such data in the file. (Not all formats contain tide data, in which case the field shows a value of zero.) If tide data is added, data must be merged before tide value can be displayed. Note: Hawkeye data does not contain tide data. |
Status | Current status flag for the selected sounding. |
Previous / Next buttons | Click the Next or Previous button to moves to the next or previous selected sounding by ping and beam number. |
Find Lidar Time Stamp | Select a sounding by its time stamp. Time stamp for Hawkeye data must be entered in microseconds |