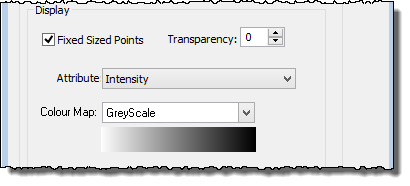
You can set the size of the displayed data points, their transparency and colour them by attribute.
The default setting for the size of points is set in the HIPS Data layer, where the size can be set from 1(smallest) to 10 (largest).
You can override this default setting for the WCI data. To have stronger returns display as larger points, and weaker returns as smaller points, (while other points in the subset are not resized):
1. Select the Water Column layer in the Data tree.
2. Clear the Fixed Sized Points check box.
If you want the WCI points to be displayed at a constant size:
3. Select the Fixed Sized Points check box.
You can toggle this display option on and off while data is loaded.
Attributes of the WCI data can be displayed one layer at a time. Each attribute (except Bottom Detection) has its own colour map. You can change the assigned colour mapping.
The attributes include:
• Intensity
• Depth
• Line
• Day
• Vessel
• Project
To view the data of a particular attribute:
4. Select the attribute from the drop-down list.
5. Select a colour map from Colour Map drop-down list.
Two colour settings for “Bottom Detection” indicate whether a point is detected bottom or not. You can change the colours of these flag settings also using the colour picker.