Data is graphed in the sensor windows on X-Y axes. In the default layout, the X-axis represents time and the Y-axis represents data.
By default, data for Gyro, Heave, Pitch and Roll sensors are displayed.
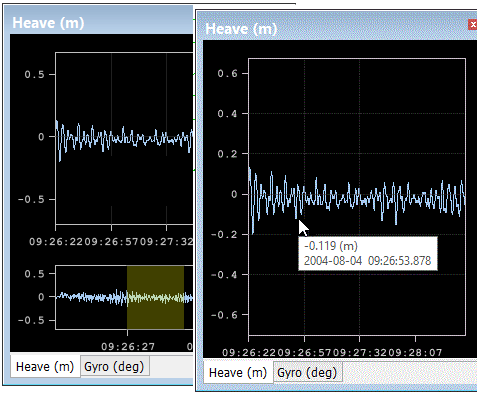
Each sensor window contains two graphs. The graph in the top of the window shows time series data for the sensor. The graph at the bottom of the window is a down-sampled view of the time series for the entire selected line.
This overview graph can be useful for locating data outliers and gaps. It can be displayed or hidden for each individual graph.
To hide the overview graph:
1. Right-click on the graph window, and select Hide Overview from the pop-up menu.
The overview is hidden, as in the example below.
Overview Slice
The overview graph contains a display slice that can be used to control the amount of data displayed and its position along the graph line.
To move along the graph line:
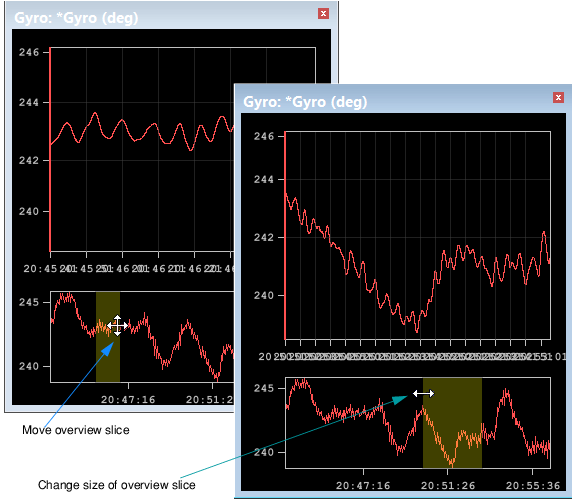
1. Click in the overview slice and drag it right or left to the new position.
As the slice moves, so does the related data. All the open sensor graphs are synchronized so moving the slice in one moves along and highlights the data in all the other graphs.
Resizing the slice control changes how much of the data is shown in the graph window. The wider the slice is, the denser the data is in the display. Making the slice narrower spreads the data out, as in the example below.
To resize the overview slice:
1. Hover over the left or right edge of the slice, until the cursor changes to an arrow.
2. Drag the slice to make it larger or smaller.
3. Alternatively, increase or decrease the value in the Time Period box on the Attitude Editor control panel.
The graph display and the size of the slice will be changed in all the synchronized graph windows. As well the Time Period value will be adjusted.