Menu | Tools > Editors > Side Scan > Signal Display Window > View Single Ping |
Tool |
|
To view the signal intensity for a single ping, instead of the mean for a selected range of pings in the Side Scan View:
1. Select View Single Ping.
Menu | Tools > Editors > Side Scan > Signal Display Window > View Single Ping |
Tool |
|
The Signal Display window is refreshed to show the sonar signal intensities for the first ping in the selected range. (The ping closest to the bottom of the Side Scan View.)
2. Use the Up arrow key to scroll up through the selected range. (Use Down to reverse direction.)
As you scroll through the selected range, the Signal Display Window will refresh to show the intensity values for each ping. The ping number is displayed in the top-right corner of the Signal Display Window in this mode. The location of the ping is also indicated by a new line within the selection. The single ping selection always defaults to the first ping in the selection.
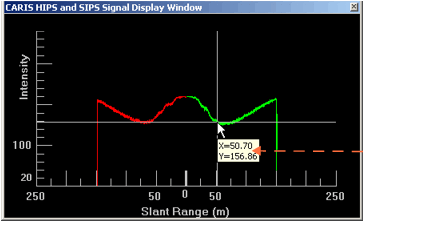
You can view the position and specific intensity values of points by clicking on any point in the graph in the Signal Display Window. The intensity and time/distance values for that point are shown in a pop-up.