Menu | Edit > Tide |
Tool |
|
Tide file information can be viewed in both graphical and tabular formats in Tide Editor. You can use the editor to edit an existing file or to create a new tide file to apply to survey lines before the Merge process.
Tide files are located by default in …\Hips\version\Tide and have a .tid file extension.
To open Tide Editor:
1. Select the Tide Editor command.
Menu | Edit > Tide |
Tool |
|
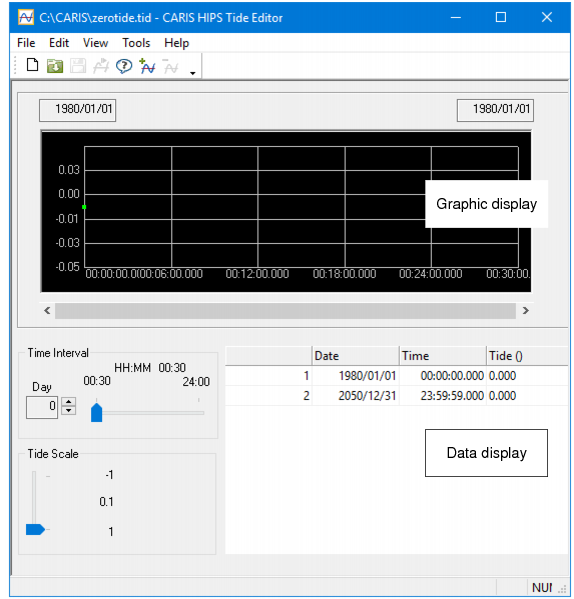
The Tide Editor interface is displayed. (For display options, see Display Options.)
To open tide data in the editor:
2. Select an Open command to display the Open dialog box.
Menu | File > Open |
Tool |
|
Key | <Ctrl+O> |
3. Select a tide file and click Open.
The tide file is displayed in the editor.The top part of the editor shows a tide versus time graph of the data. Tide-level values are represented on the vertical axis. Time is represented on the horizontal axis. These can be adjusted using slider controls.
In the example below, the data points in the graph show as a dark blue on the lighter blue line. Selected points are white.
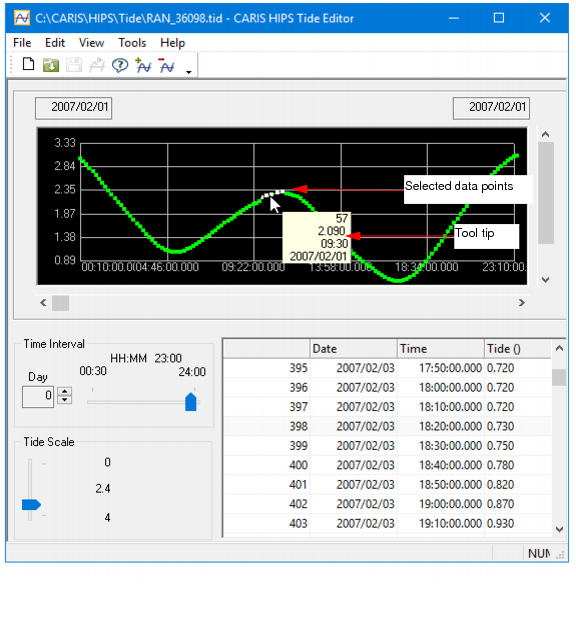
When data is selected points in the graph, the table below it is refreshed to display the rows containing the data for the selected points.
If you click in the table, those rows will be highlighted. You can move to from graph to table and back, and the corresponding data will be highlighted in both views.
When you change the time interval or time scale, you may need to click in the table again to see the highlighting for any selected data points. |
Adjust tide scale
To control the vertical scale of the graphical display:
• Move the Tide Scale slide bar to select a range for the height of the vertical tide axis.
Adjust time interval
Change the horizontal scale by adjusting the Time Interval setting.
• The day option enables you to view data by 24-hour increments.
• The hour/minute option enables you to view data in increments of less than 24 hours.
1. Click the Day arrow buttons to select the range of days for displaying data.
2. If the Day value is set to zero then move the slide bar to select the minute/hour range for the display of data.
The display of tide data is adjusted for the new time interval along the horizontal axis.
Save a tide file
Save changes to an existing tide file.
1. Select the Save command.
The file is saved with the changes.

