The 2D View displays the datasets that are currently open in the application and selected for display. You can have one 3D View window and multiple 2D View windows open at the same time, if desired. Properties for the 2D View are set using 2D View Properties.
The order in which data is visible in the 2D View is controlled by the Layers window. See Layers Window.
The 2D View is the only window that cannot be moved or docked.
Band tooltips
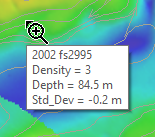
Moving your cursor over data in the 2D View will make a tooltip box appear. This will display the name of the layer that is the source of the data at the current location, as well as the value of the data based on the bands selected for inclusion in the tooltips. In the example below, the tooltip displays 3 band values for the current location of the cursor.
By default, the Z band is displayed as the active band for a coverage. Additional band values can be included in the tooltip by selecting the band names in the Tooltip Bands property in the Properties window. See Properties Window for more information.
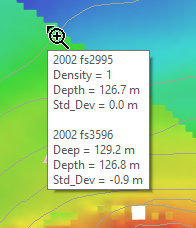
You can also set the tooltip to include source names and values for all coverages in the view, by setting the Show all visible Coverages in tooltip option in Tools > Options > Coverages to True.
This will cause all raster grids, point clouds, reference models, TINs and variable resolution surfaces that are turned on, and have data at the cursor location, to be listed in the tooltip as sources along with their band values. The example below displays the 3 band values for 2 different coverages.