Menu | Tools > Engineering Analysis > Conformance > Analyze Conformance |
The Analyze Conformance command is used to visually identify which areas of a surface conform to the reference model and which do not. To accomplish this, a new surface is calculated based on the differences in depth between the reference model and the selected surface. This surface is then coloured according to risk classifications defined in a colour range file. The default conformance colour range file uses the following risk classifications:
• Areas that are shoaler than the reference model are considered to be unsafe.
• Areas that are deeper than the reference model are considered to be safe.
• Areas that have similar values to the values in the reference model are considered to be caution areas.
The value ranges for each classification are controlled by a colour range file. By default, the Conformance.crf file is used with the following ranges:
• Data 0 to 99 units shoaler than the reference model is classified as unsafe and coloured red.
• Data 0 to 1 units deeper than the reference model is classified as cautionary and coloured yellow.
• Data 0 to 99 units deeper than the reference model is classified as safe and coloured green.
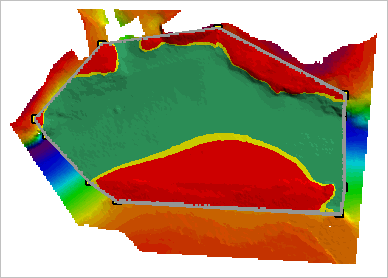
Below is an example of a conformance surface displayed on top of the reference model and source surface.
Interface
The Analyze Conformance command uses the following dialog box.
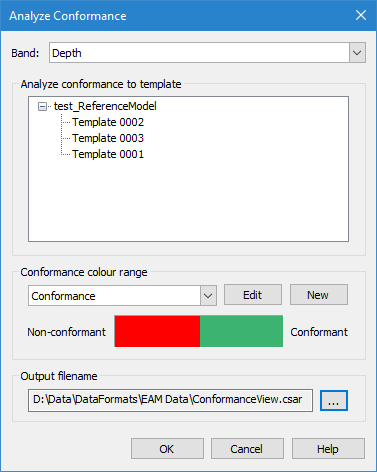
Option | Description |
Band | The band of the input surface to be used as the height source. The options available are based on the bands present in the source surface. Select an option from the drop-down list. |
Analyze conformance to template | The template of the reference model that you want to compare to the elevation band in a surface. All templates in the reference model will be listed. 1. Click a template name to select it. |
Conformance colour range | The colour range file to apply to the resulting data. You have the option of using an existing colour range file, editing an existing file or creating a new file. See Colour Range Editor for information on colour range files and the Colour Range Editor. 1. To use an existing file, expand the drop-down list and select a range file from the list. |
Edit | The Edit button is used to launch the Colour Range Editor and edit an existing colour range file to define new range values for the conformance analysis. 1. Expand the Conformance colour range drop-down list and select a range file from the list. 2. Click Edit. The Colour Range Editor is displayed. 3. Adjust the colour range values as needed and click OK. You are returned to the Conformance Analysis dialog box and the colour bar is adjusted to represent the new range values. |
New | The New button is used to launch the Colour Range Editor and create a new colour range file for the conformance analysis. 1. Click New. The Colour Range Editor is displayed. 2. Define the colour range values as needed and click OK. You are returned to the Conformance Analysis dialog box. The new file is displayed in the drop-down list and the colour bar is adjusted to represent the new range values. |
Output filename | The name and location to use to store the resulting file. 1. Click the browse button (...) to launch a standard Windows Save As dialog box. 2. Select a location for the new file and enter a file name. 3. Click Save. |
Procedure
1. Open the surface and reference model you want to compare.
2. In the Layers window, select the surface you want to use as the elevation values for the comparison.
3. Select the Analyze Conformance command.
The Analyze Conformance dialog box is displayed.
4. Select the template of the reference model that you want to compare to the elevation band.
5. Select or define a colour range file to apply to the resulting data.
The Non-conforming/Conforming colour bar is updated to reflect the values in the colour range file selected.
6. Define a name and location for the new file.
7. Click OK to perform the analysis.
When finished, the new surface will be opened and coloured according to the colour range file. This surface can also be viewed in 3D, giving a better view of the conformity.