4. Select the Draw bars check box.
The following options graph other lines for comparison to the data graph.
• Filter/Smooth Line graphs the computed values derived from the adjacent data points and displays this line in the graph. This option applies the parameters set in the Data options.
• Difference graphs a line showing the difference between the original data values and the moving average or FFT value for each data point.
• Threshold option displays horizontal lines in the graph indicating the difference values that are clipped during smoothing. Threshold is a multiple of the standard deviation (sigma).
• The upper threshold signal is determined by the following formula:
original mean value + (threshold value X the standard deviation)
• The lower threshold signal is determined by the following formula:
original mean value - (threshold value X the
standard deviation
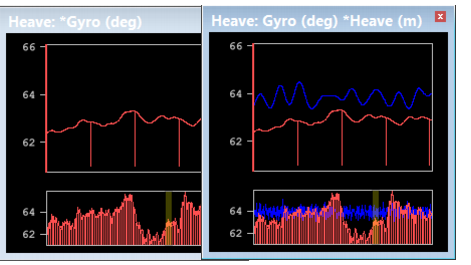
In this example, GPS height and tide, are graphed. The blue line represents the original data and the yellow line represents the smoothed data.