The vertical scale is inverted and the graph line redrawn. 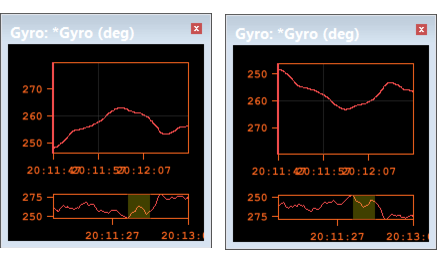
3. Select the Invert option.
The vertical scale is inverted and the graph line redrawn.
The Draw Bars function displays vertical bars under the graph line. This option makes it easier to see time gaps between sensor values. If multiple data types are displayed in one graph, the vertical bars are drawn only for the active data type.
To view the graph with vertical bars: