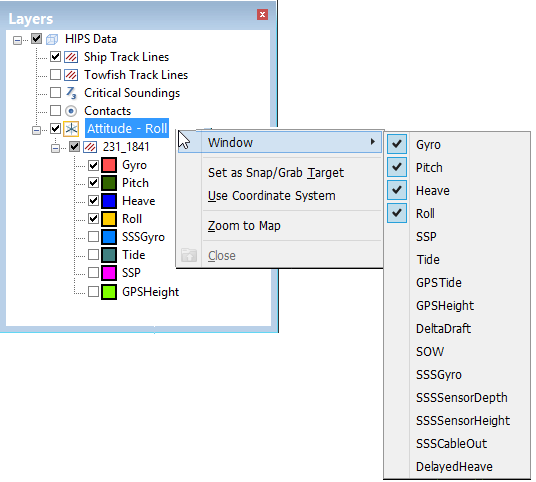
3. Select the name of the sensor window to display.
.
The data for each selected sensor will be graphed in its own window.