Menu | Tools > Editors > Side Scan > Signal Display Window > Open/Close |
Tool |
|
Menu | Tools > Editors > Side Scan > Signal Display Window > Open/Close |
Tool |
|
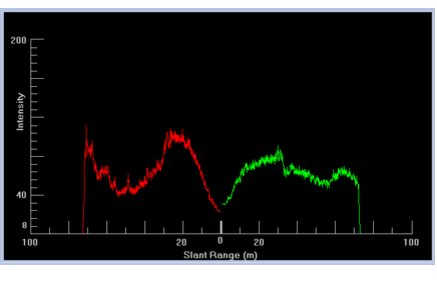
The Signal Display Window displays graph of signal intensity against across-track distance in processed mode (or against time, in raw mode).
The vertical axis on the graph represents intensity level of the signal(s) being examined. The horizontal axis represents either time or slant-range distance depending on the display mode of the Side Scan View (“waterfall” view). See Side Scan data display.
The graph can display either a mean of all sonar intensities in a selection, or else the sonar intensity values for a single ping. You can switch back and forth between mean and single profile modes using the buttons on the toolbar.
Once the Signal Display window has been opened, it will remember its previous setting and display either the mean intensity values for the entire selection or the intensity values of a single profile.
If a beam pattern has been loaded to the line in Side Scan Editor, it will be displayed as a yellow line in the Signal Display window. |
Procedure
1. Select a line in the Display window and open Side Scan Editor.
2. Select a range of pings in the Side Scan View using the Side Scan Selection tool (see “Selection” on page 77).
3. Select the Signal Display Window tool.
The Side Scan Signal Display window opens and displays a graph of the mean intensity values for the selected range.
View Single Ping
To view the signal intensity for a single ping, instead of the mean for a selected range of pings in the Side Scan View:
1. Select View Single Ping.
Menu | Tools > Editors > Side Scan > Signal Display Window > View Single Ping |
Tool |
|
The Signal Display window is refreshed to show the sonar signal intensities for the first ping in the selected range. (The ping closest to the bottom of the Side Scan View.)
2. Use the Up arrow key to scroll up through the selected range. (Use Down to reverse direction.)
As you scroll through the selected range, the Signal Display Window will refresh to show the intensity values for each ping. The ping number is displayed in the top-right corner of the Signal Display Window in this mode. The location of the ping is also indicated by a new line within the selection. The single ping selection always defaults to the first ping in the selection.
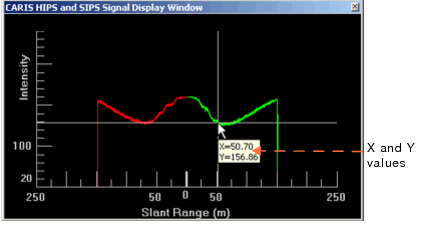
You can view the position and specific intensity values of points by clicking on any point in the graph in the Signal Display Window. The intensity and time/distance values for that point are shown in a pop-up.
View Selection Mean
To switch the display from the values for a single ping back to the mean of the intensity values in the entire selected range:
1. Select the View Selection Mean tool.
Menu | Tools > Editors > Side Scan > Signal Display Window > View Selection Mean |
Tool |
|
The graph in the Signal Display window is refreshed to show the mean values of the selection.


