Menu | Create > Grid > Areas |
Menu | Create > Grid > Lines |
Create a grid of lines or areas in the current view of the chart:
• Lines grid: A grid formed of lines.
Areas grid: A grid where each cell is an area. Each area is assigned an alphanumeric code which is stored in an attribute, which you select when you configure the grid.
A grid can be used to organize operations such as search and rescue, or to systematically review data cell by cell. Grid lines or areas are features and can be saved for future editing.
Procedure
1. Select the Create Areas Grid or Create Lines Grid command.
2. Select an acronym and set any necessary attributes as described in Create.
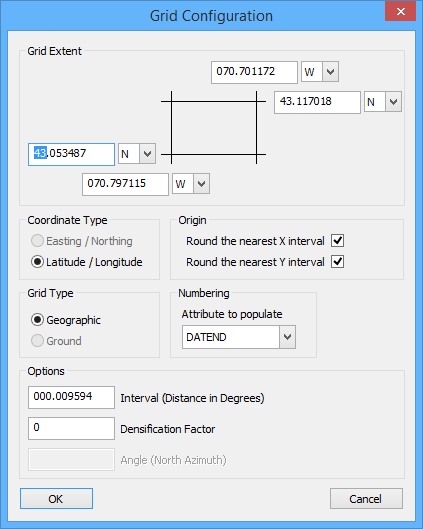
The Grid Configuration dialog box is displayed.
Option | Description |
Grid Extent | The extent of the grid. The default is the current area in the Display window. To change the grid extent, type new values for the corners. Press <Tab> to move between fields. |
Coordinate Type | Choose from: • Easting/Northing: The lines of the grid rid follow a constant X and Y in a projection. • Latitude/Longitude: The lines of the grid correspond to parallels of latitude and meridians of longitude. |
Origin | Round the nearest X interval: • On: Rounds the X coordinate of the grid origin so that grid spacing remains constant. • Off: The X origin of the grid is not rounded. The spacing of the outer grid lines may differ from the inner lines. Round the nearest Y interval: • On: Rounds the Y coordinate of the grid origin so that grid spacing remains constant. • Off: The Y origin of the grid is not rounded. The spacing of the outer grid lines may differ from the inner lines. |
Grid Type | The type of coordinates used for the grid. Choose Ground or Geographic. The units of the Interval option change to match. |
Numbering | The attribute used to store the two-character location code of an areas grid. Select from • DATEND Date end • DATSTA: Date start • INFORM: Information • NIMFOM: Information in national language • PEREND: Periodic date end • PERSTA: Periodic date start • SORDAT: Source date • SORIND: Source indication |
Options | • Interval: The interval between grid lines. The units change according to the Grid Type option. Type a value. • Densification Factor: Add points to a line to make it look more curved. Type a value. • Angle: Rotate the grid lines. This is active only for ground type grids. Type a degree. |
3. Set any necessary options.
4. Click OK.
The grid is drawn in the Display window.