Menu | Tools > Surfaces > Vectorize Raster |
Pop-up | raster surface > Vectorize Raster (Layers window) |
Create polygons around populated areas of a raster surface, based on the values in a selected band, to provide a vector representation of the data. Depending on the selected settings, polygons will be created following the pixel boundaries of the included nodes for either:
• each populated section of the coverage, or
• each group of adjacent nodes with the same value.
Polygons are also created for holes in any internal areas where no data was defined in the band.
The polygon features are created with a user-specified object acronym and saved to a feature layer. This feature layer can be saved as a HOB file, if desired, using the Save command.
The units and z-axis direction of the output are controlled by the pool of the feature catalogue of the output. If the input cannot be converted to those units and z-axis convention, then the values are simply copied from the input data.
Interface
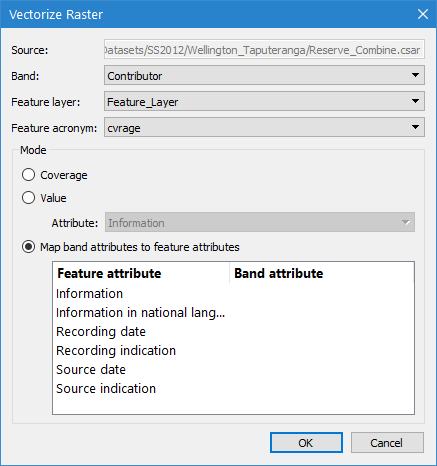
The Vectorize Raster command uses the following dialog box.
Option | Description |
Source | The input data for the process. The Source is defined by the surface that was selected at the time the command was initiated. This field cannot be changed. |
Band | The band in the source surface that contains the data for which vector objects will be created. |
Feature layer | The feature layer on which the vector objects will be created. |
Feature acronym | The object acronym to assign to the new vector objects. |
Coverage | The mode determines where to create polygons for the source data. The Coverage mode generates a polygon around each set of joined pixels in the source surface. |
Value | The mode determines where to create polygons for the source data. The Value mode generates a polygon around pixels with the same value. This mode is only valid for integer scaler type or string table type bands. When using this option, you must specify the attribute to use for the value of the polygons. The attributes available in the drop‑down list are determined by the Feature acronym selected for the output. 1. Select the Value option. 2. Select an Attribute from the drop-down list. |
Map band attributes to feature attributes | The mode determines how and where to create polygons for the source data. The mapping mode allows you to map individual components of a string table band, such as Contributor, to user-specified attributes and assign them to new feature objects. It is possible to map the same component, or the entire value, to multiple attributes. The mapping is defined using the table that is enabled when the Map option is selection. The Feature attributes available for mapping are determined by the Feature acronym selected for the output. The Band attributes available are determined by the values present in the selected input Band. 1. Select the Map option. 2. Select the row for the Feature attribute you want to map. 3. Select a Band attribute from the drop-down list to map to the Feature attribute. 4. Repeat for each attribute you want vectorized. |
Procedure
1. Create or open a feature layer to contain the resulting feature objects.
2. Select the root layer of a raster surface in the Layers window.
3. Select the Vectorize Raster command.
4. Select a Band from the drop-down list.
5. Select a Feature layer from the drop-down list.
6. Select a Feature acronym from the drop-down list.
7. Choose a vectorize Mode.
8. [Optional] If using the Value mode, select an Attribute from the drop‑down list. If using the Map mode, complete the attribute mapping table.
9. Click OK.
Feature objects are created on the designated feature layer representing the areas where data values are present in the selected raster band.