Menu | File > Import Wizard |
Tool |
|
Infrastructure maintenance often involves comparisons between both of the surveyed and modelled state of the infrastructure, and also comparisons between the state in successive periods in order to determine what changes have occurred. This is the case, for example, for managing seafloor depths before and after dredging. It is also relevant for vertical structures such as quay walls that can deform over time due to the pressure above ground, or that can be undercut by the movement of water.
A rich variety of tools can work on raster surface representations of LIDAR and sonar surveys. A first step is to produce these raster surface representations. The tools described in this section provide additional capability to create raster surface representations of vertical areas. See New Vertical Surface Features and Relevance Distancesfor more information on creating vertical reference model surfaces.
Vertical Planes
Vertical planes can be modelled in a reference model by choosing two x,y locations and two depths for each point. That produces a rectangular vertical wall in general. However, the walls can be customized by assigning one of the two x,y locations to have a single depth, resulting in a triangular vertical wall. If digitizing a vertical surface along two existing complete reference model surfaces, the depths and orientation for the vertical surface are automatically determined from the existing surfaces. This simplifies the modelling of infrastructure such as quay walls. Vertical surfaces can be created, added to and removed from supersurfaces and templates. They can also be viewed in 3D.
Gridding based on a Reference Model
Imported data can be gridded along planes defined by reference model surfaces. To import a surface using a reference model:
1. Select one or more reference model surfaces (including vertical surfaces) and/or templates.
If a reference model template is selected, all the reference model surfaces, including vertical surfaces, in the template are considered. If no selection is made, all of the reference model templates are considered. If no selection is made and no reference model templates exist, all the reference model surfaces in the model are considered.
The Import Wizard is used in the creation of raster surfaces through this command.
Menu | File > Import Wizard |
Tool |
|
2. Select the Import Wizard command.
The Import Wizard is displayed. The first step lists the data formats that can be imported.
3. Select the format of the data you are importing.
4. Click Next.
The Import Wizard: Files to Import step (Step 2) is used to select the file(s) to be imported into BASE Editor.
You can import a single file or multiple files at once. The result will be a single CSAR file, regardless of the number of files imported. If importing multiple files, they must all have the same coordinate system and be in the selected format.
1. Click Select to locate a file to import.
The standard Windows Open File dialog box is displayed.
2. Select one or more files and click OK.
3. Click Next.
The Import Wizard: Input Settings dialog box (Step 3) is used to define settings for the data being imported. 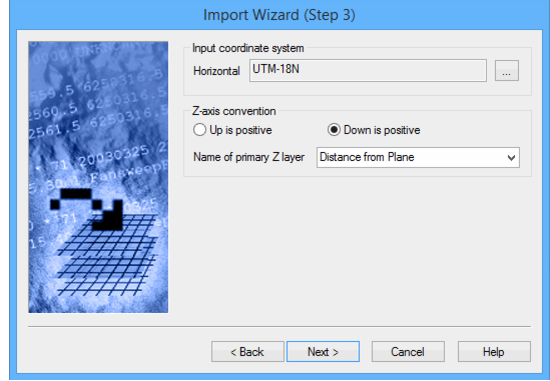
4. Select Distance from Plane as the Name of primary Z layer
5. Click Next.
The Import Wizard: Input Settings dialog box (Step 4) is used to define a gridding method and settings for the data being imported. The gridding operation considers points within a defined tolerance of each reference model surface, to preclude 'distant' features being considered.
6. Choose the Vertical output coordinate system.
7. Select either Point Cloud or Grid from the Output data type.
8. Select a gridding method from the Gridding Method drop down list.
9. Click Next.
The Import Wizard: Retrieve Coverage dialog box (Step 5) is used to define the extents of the surface.
10. Select the desired spatial parameters from the Import Wizard Step 5.
11. Click Next.
The Import Wizard: Attributes dialog box (Step 6) lists the attributes available for the dataset based on the file being imported. For vertical or inclined data, Farthest above and Farthest below may be selected from the computed statistics.
12. Select the desired Format-specific attributes and Computed attributes.
13. Click Finish.
The names for each reference model surface are used in the name of the resulting raster surface. All of the raster surfaces are produced in a single CSAR file, selected by the user in the import wizard.
Gridding based on a reference model produces multiple raster surfaces in a single CSAR file. When the CSAR is opened, all of the raster surfaces are automatically displayed as being part of a group. It is possible to perform regular grouping operations, such as ungrouping the raster surfaces. Note that even once the raster surfaces are ungrouped, they are still stored in a single CSAR file. It is possible to use Save As in the right click menu of the Layers window to extract a single raster surface into a separate CSAR file. See the Save As topic in the CARIS BASE Editor Reference Guide for more information.
The Z values displayed when selecting and/or exporting these raster surfaces are based on the traditional top-down datum, as are the X and Y values (Northings/Eastings or Latitude/Longitude). Internally, there is a distinct coordinate reference system for the raster surface, establishing a rotated grid, but those internal coordinates are an internal detail. The rotated grid can be seen through the planar normal and offset properties, as well as the structure of the grid, and the spatial bands contain values that are distances from the plane.
Interpolate
The Interpolate Entire Dataset command can be used to fill empty nodes in a grid using values from surrounding populated nodes. As a raster surface representing vertical infrastructure is often done at high resolution, there are often holes in areas where data acquisition was not sufficiently fine. The interpolation procedure will fill in these holes, according to the parameters chosen, and will produce a new raster surface gridded relative to the same plane as the original raster surface.
Menu | Tools > Surfaces > Interpolate > Entire Dataset |
Pop-up | Interpolate (raster surface) |
Difference
Create a surface showing the differences in attribute values between two raster surfaces in order to determine the amount of deformation that has taken place.
Surface Difference is useful for comparing changes to an area over time. A difference surface can be used to monitor these changes by comparing two surfaces for the same area that were created at different times. The surface difference relative to a model or two raster surfaces of surveys from different epochs can be determined.
To determine the deformation, a new surface is calculated based on the differences in distance from a plane between the reference model and the selected surface. This Difference surface is then coloured according to risk classifications defined in a colour range file.
To use this tool, select two files that cover part or all of the same area. The data in the surfaces must be of the same type. The data types include short, integer, float, and double.
When you select a layer from one of the lists, its data type will be displayed in the Data Type field.
1. Open the surfaces you want to compare.
2. Select a surface’s root layer in the Layers window.
Menu | Tools > Surfaces > Difference |
3. Select the Difference command.
The Difference Surface dialog box is displayed.
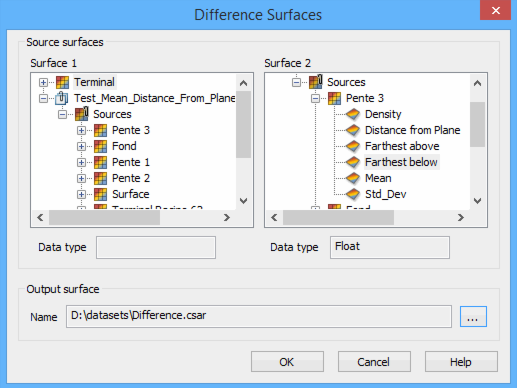
Any data open in the application at the time, that can be used with the Difference command, is listed in the Surface fields.
4. Click the expand ( + ) icon beside a layer in the Surface 1 list to view the available surface layers.
You must select a surface layer to use as the data source for the difference calculation.
5. Select a surface layer.
The Data Type field displays the data type of the selected layer.
6. Click the expand ( + ) icon beside a layer in the Surface 2 list.
7. Select a surface layer with the same data type as the layer selected for Surface 1. In addition, the Surface 2 raster surface must be defined relative to the same plane as the Surface 1 raster surface.
The Data Type field displays the property for the second selected surface attribute.
8. Click Browse (...) to define the name and location for the new surface files.
9. Click OK.
A new Difference surface is created and added to the Layers window.
Menu | View > 3D View |
Tool |
|
10. [Optional] Turn on the 3D view by choosing View > 3D View.
11. In the Layers window, turn on the Diff band layer.
12. Refresh the Display window.
The Difference surface is displayed in 3D.
See the Difference and 3D View topics in the CARIS BASE Editor Reference guide for more information.
TINs
TINs can also be created for raster surfaces gridded relative to planes. These TINs can be viewed in both 2D and 3D, and can be rotated in the 2D display to be viewed face on. They can be used in volume calculations used in the monitoring of deformation, such as that of quay walls. Profiles of TINs can be created using the BASE Editor profiling tools.
To create a TIN on an inclined surface:
Menu | Tools > TIN > Create TIN |
Tool |
|
1. In the Layers window, select a layer containing depth/height values.
2. Select the Create TIN command.
3. A TIN layer is created and added to the layers window.
4. Select the TIN layer and refresh the Display window to view the TIN.
5. [Optional] Turn on the 3D view by choosing View > 3D View.
6. [Optional] In the 2D view, right click on the TIN layer and choose Use Coordinate System to display the raster surface and its TIN face on.
Profiles
For raster surfaces gridded relative to a vertical plane or TINs of these rasters, only profile lines that are perpendicular to the vertical plane will produce a result in the Profile window. For raster surfaces gridded relative to an inclined plane, profile lines must be oriented down the slope of the inclined plane. As a result, it is recommended to create profiles through the Cross Profile tool in BASE Editor or through Stationing in the Engineering Analysis Module. Also note that if the inclined planes are created using the Cross-section tool in the Engineering Analysis Module, the top of the inclined plane is well-defined, as is the orientation of the slope of the inclined planes.
An example of a profile of a raster surface gridded relative to a vertical plane is shown below: