Menu | Tools > Engineering Analysis > Conformance > Analyze Conformance |
Tool |
|
The Analyze Conformance command is used to visually identify which areas of the surface conform to the reference model and which do not. To accomplish this, a new surface is calculated based on the differences in depth between the reference model and the selected surface. This surface is then coloured according to risk classifications defined in a colour range file. The default conformance colour range file uses the following risk classifications:
• Areas that are shoaler than the reference model are considered to be unsafe.
• Areas that are deeper than the reference model are considered to be safe.
• Areas that have similar values to the values in the reference model are considered to be caution areas.
The value ranges for each classification are controlled by a colour range file. By default, the Conformance.crf file is used with the following ranges:
• Data 0 to 99 units shoaler than the reference model is classified as unsafe and coloured red.
• Data 0 to 1 units deeper than the reference model is classified as cautionary and coloured yellow.
• Data 0 to 99 units deeper than the reference model is classified as safe and coloured green.
To analyze the conformance of a surface to a reference model:
1. Open the surface and reference model you want to compare.
2. In the Layers window, select the layer of the surface you want to use as the elevation values for the surface.
3. Select the Analyze Conformance command.
Menu | Tools > Engineering Analysis > Conformance > Analyze Conformance |
Tool |
|
The Analyze Conformance dialog box is displayed.
4. Select the template of the reference model that you want to compare to the surface layer.
You have the option of using an existing colour range file, editing an existing file or creating a new file.
5. Use one of the following methods to select the colour range file to use for analysis:
• Select an existing colour range file from the list.
• Select an existing colour range file from the list and click Edit to customize the ranges.
• Click New to create a new colour range file.
If you chose to use an existing colour range file, go to step 16. If you chose to edit or create a new colour range file, continue to the next step.
The Colour Range Editor dialog box is displayed.
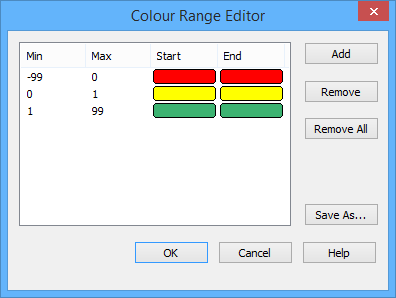
If you chose the Edit option, the colour ranges of the selected file are displayed in the window. Clicking OK will overwrite the existing file with the new changes. Alternatively, you can select to create a new file using Save As. If you chose the New option, the window is empty and a new file will be created.
6. To save the colour ranges to a new file, click Save As.
A Save As dialog box will be displayed. By default, all colour files are saved in the following directory:
C:\ProgramData\CARIS\BASE Editor\<version>\Colour
7. Enter a File name and select a location for the new colour range file.
8. Click Save to close the dialog box and return to the Editor.
Any changes you make now will automatically be saved to the new file.
9. To edit an existing range, double-click the range in the window.
To create a new range, click Add.
The Add Range dialog box is displayed. If you chose an existing range, the current values and colours are populated. The Min value defines the minimum value to be included in the colour range. The Max value defines the maximum value to be included in the colour range. The colour will be applied to all data that falls within the specified range. If you choose the same colour for the start and end of a range, all points/nodes within that range will be assigned the same colour. If you choose different colours for start and end, a gradual change in colour will be applied to the display as the values get closer to the Min or Max value of the range.
10. Enter a value in the Min field and select a colour from the Start colour picker.
11. Enter a value in the Max field and a select a colour from the End colour picker, usually the same colour as the Start value.
12. Click OK to close the Add Range dialog box and return to the Colour Range Editor.
The range you defined is added to the window.
13. Continue adding or editing ranges as needed.
14. When all ranges are defined, click OK to close the Colour Range Editor and return to the Analyze Conformance dialog box.
The Non-conforming/Conforming colour bar is updated to reflect the values in the colour range file you selected.
15. Click Browse (...) for the Output filename field.
A Save As dialog box is displayed.
16. Enter a File name and select a location for the new CSAR file then click Save.
17. Click OK to perform the analysis.
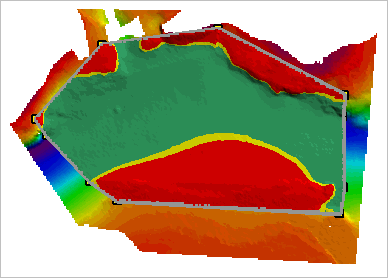
When finished, the new surface will be opened and coloured according to the classifications. This surface can also be viewed in 3D, giving a better view of the conformity.
Below is an example of a conformance surface displayed on top of the reference model and source surface.