Menu | Tools > Swath Editor > Open |
Tool |
|
Pop-up | Tools > Swath Editor |
To view WCI data in Swath Editor:
1. Select a survey line in the Display Window.
2. Select the Open Swath Editor command.
Menu | Tools > Swath Editor > Open |
Tool |
|
Pop-up | Tools > Swath Editor |
If the selected line contains WCI data:
• the data will be loaded into the Along and Across track windows,
• the Water Column Editor toolbar will be displayed,
• and the WCI will be displayed in the Swath Editor Control page.
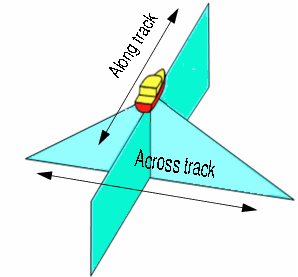
In Swath Editor, water column imagery is displayed in two windows:
• Across (track) View: the water column data as viewed from the stern of the survey vessel. There is an across track image for each selected profile (ping). (Also referred to as a profile view, polar intensity plot or swath profile.)
• Along track view: displays the water column data viewed from the starboard side of the vessel. This could also be referred to as a side view or vertical profile. The along track image is made up of the beams which point to nadir for the selected profiles.
The Across and Along View are only visible when the Water Column Editor is open. To restore a closed Across or Along view, select the View from the Window> Other Windows menu.
Stacked view
WCI can also be displayed in a “stacked” view, to give an idea of what may be in the water column based on multiple profiles and beams. In the Across track view all the profiles represented in the Plan view are stacked one on top of another.
In the Along track view the beams within a profile are stacked with the highest intensity beams showing through. See Stacked view.
Bottom detections
Bottom detections can be plotted on top of the water column image in the Across track view. This can be used to view how the existing bathymetry compares to that which is present in the water column data. This display can be toggled on and off from the Water Column toolbar.
Data display example
The example below shows WCI data displayed in the across and along track windows, and bathymetry in the Display window (shown as a surface). 1
3. Select a profile, for example, in the Plan View.
The related WCI data is displayed in the water column windows
Scroll through the Plan view using the arrow keys, or scroll buttons, to see the water column image in the across and along track views.
To highlight a WCI profile in the Swath Editor views:
4. Click the middle mouse button in the Along track window.
As each profile is highlighted, the display in the Swath Editor windows is automatically refreshed.
As well, there is a slider bar in the Across track window, similar to that of the Profile window, which you can use to scroll through the data.
1 Image courtesy of John Hughes Clarke, Ocean Mapping Group, University of New Brunswick.
