.
All sensor data in HIPS/SIPS format can be displayed in the Attitude Editor graphs except for depths, navigation, and side scan data.
The default graph windows display:
• Gyro: Gyro observations are displayed in degrees from positive 0 to 360.
• Heave: Heave observations are displayed according to the Elevation > Depth Units set in the Options > Display Units dialog box and are positive as the vessel moves upward.
• Pitch: Pitch observations are displayed in degrees and are positive when the bow is down.
• Roll: Roll observations are displayed in degrees and are positive when the starboard side is up.
The following sensors can also be displayed if data is available for them:
• surface sound speed profile (SSP)
• tide (loaded or converted)
• GPS tide
• GPS height
• delta draft
• speed on water (SOW)
• side scan gyro
• side scan depth
• side scan height
• side scan cable out
• delayed heave
• RMS data, loaded using Load Auxiliary Data
However, if the survey data does not contain any data from a selected sensor, the graph window will report that there is no data to display.
To display a graph window for a sensor other than the default sensors:
Menu | Tools > Editors > Attitude > (list of sensors) |
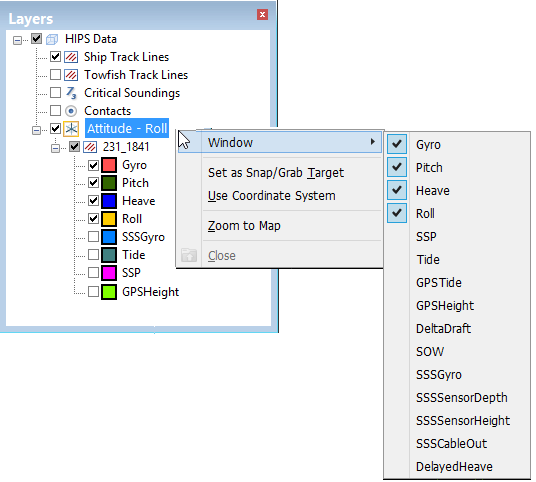
Pop-up | Window (Layers window) |
1. Select the sensor by name from the Attitude Editor list.
Sensor windows can also be turned on from the Layers window.
2. Right-click on the top Attitude layer, and select Window from the pop-up menu.
3. Select the name of the sensor window to display.
.
The data for each selected sensor will be graphed in its own window.