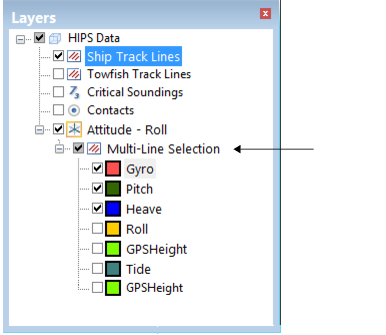
The data from multiple lines can be edited in Attitude Editor. When multiple lines are selected this is indicated in the Layers window.
Overview of multiple lines
The line data is displayed in the graph, coloured using the settings for the sensors. The Overview graph shows a down-sampled graph of all of the lines as illustrated below.
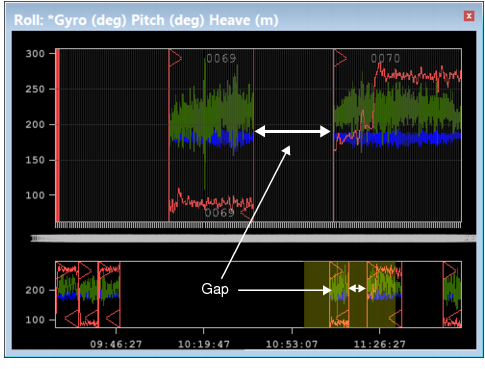
Disparities in time are displayed as gaps in the graph lines.
Lines that are selected in the Display window when the Attitude Editor is active, will be coloured with the Selection colour set in Tools > Options > Display > Sensor Editors.
Move from line to line
In the Project window, any line that has a check mark is open in Attitude Editor. To move from one line to the next:
1. Use the Select > Track Line > Next (or Previous) command, or,
2. Click on a specific line in the Project window to display the data for that line.
Editing can be applied to any line open in the Editor, using the Accept, Reject With and Reject Break interpolation commands on the right-click menu.
Filter and Smoothing options are disabled when in multi-line mode. - Under Current View, The Filter / Smooth line, Difference and Threshold fields are greyed out. - All Data options are disabled. |
Tooltips
When multiple lines are displayed in Attitude Editor, tooltips in a graph will display time of data, line identification in PVDL format as well as the active sensors, as in the example below.
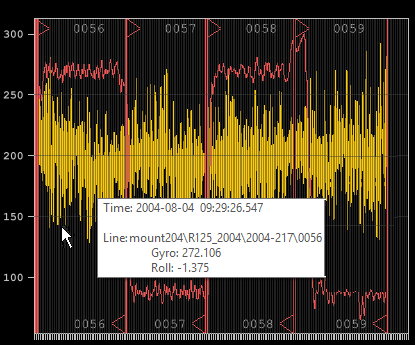
See Display Options to turn on the tooltip option.