Menu | Tools > Editors > Side Scan > Signal Display Window > Open/Close |
Tool |
|
Menu | Tools > Editors > Side Scan > Signal Display Window > Open/Close |
Tool |
|
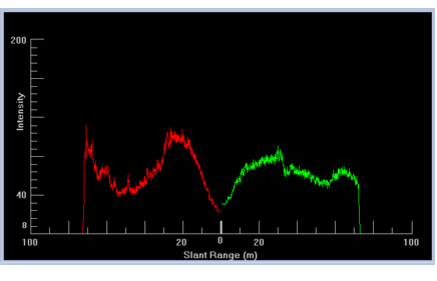
The Signal Display Window displays graph of signal intensity against across-track distance in processed mode (or against time, in raw mode).
The vertical axis on the graph represents intensity level of the signal(s) being examined. The horizontal axis represents either time or slant-range distance depending on the display mode of the Side Scan View (“waterfall” view). See Side Scan data display.
The graph can display either a mean of all sonar intensities in a selection, or else the sonar intensity values for a single ping. You can switch back and forth between mean and single profile modes using the buttons on the toolbar.
Once the Signal Display window has been opened, it will remember its previous setting and display either the mean intensity values for the entire selection or the intensity values of a single profile.
If a beam pattern has been loaded to the line in Side Scan Editor, it will be displayed as a yellow line in the Signal Display window. |
Procedure
1. Select a line in the Display window and open Side Scan Editor.
2. Select a range of pings in the Side Scan View using the Side Scan Selection tool (see Selection).
3. Select the Signal Display Window tool.
The Side Scan Signal Display window opens and displays a graph of the mean intensity values for the selected range.