Gadget Type | Icon | Description |
|---|---|---|
Graphing |
| This gadget is used to show a live preview of an existing graph. Moving the mouse cursor over the graph will show values for each dataset at the cursor location. The wheel button on the mouse can be used to zoom in and out of the graph and the left mouse button can be used to drag the graph to the left and right to change the visible data range. The Options button • Go to Graph: Go to the details page of the graph being displayed in the gadget. • Delete Gadget: Delete the gadget from the dashboard. This does not affect the data source associated with the gadget, it only removes the gadget. |
Note |
| This gadget is used to display textual notes that have been manually entered by the user. |
Alarms |
| This gadget is used to show statistics of alarms that have been triggered for a specific site. The Options button • Refresh Interval: The frequency at which the data in the gadget is refreshed. The possible intervals are 1 minute, 5 minutes, 10 minutes and 15 minutes. • Go to Alarm: Go to the details page of the alarm being displayed in the gadget. • Delete Gadget: Delete the gadget from the dashboard. This does not affect the data source associated with the gadget, it only removes the gadget. |
Site |
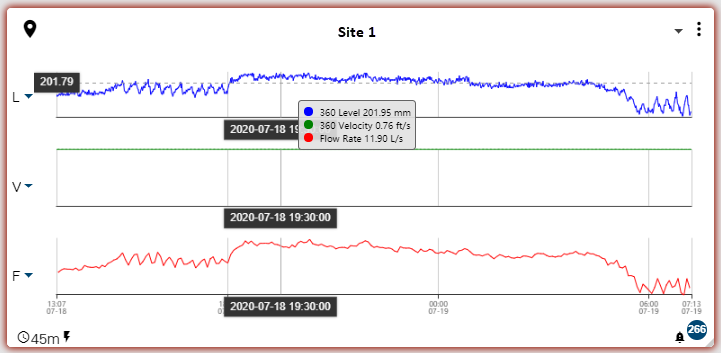
| This gadget is used to display information about a specific site, including a graph of the most recent level, velocity and flow rate data and a timestamp of the last time data was ingested from the site.
When a site contains multiple datasets for the level, velocity and flow rate data types, the user can select which dataset to display in the gadget using the drop-down list of dataset names adjacent to the L, V, F labels. The graph data will be displayed according to the settings in the Preferences tab of the user profile page. If these settings have not been defined, the following colors will be used by default: • Level - Blue • Velocity - Green • Flow Rate - Red When the cursor is hovering over a dataset’s graph in the gadget a tooltip is displayed. The tooltip contains the dataset name and value with units at the location of the cursor. Site gadgets will display with a colored border indicating the status of the site. This allows a quick visual check of the status of each site in the dashboard. The possible colors include: • Yellow: The site is not receiving data. • Red: An alarm has been triggered by the site. This can be any type of alarm. The Options button • Refresh Interval: The frequency at which the data in the gadget is refreshed. The possible intervals are 1 minute, 5 minutes, 10 minutes and 15 minutes. • Change Period: The time period for which data will be included in the graph displays. The available times are the last 24 hours, 48 hours or 72 hours. • Go to Site: Go to the details page of the site being displayed in the gadget. • Graph from Site: Go to the Configure Graph page with the site and datasets from the site gadget selected for a new graph. The datasets, and the order in which they are displayed in the site gadget, will be repeated in the new graph. • Delete Gadget: Delete the gadget from the dashboard. This does not affect the data source associated with the gadget, it only removes the gadget. Along the bottom edge of the site gadget the following information and controls are located: • Elapsed time since last data received. If the site is receiving data, a clock symbol precedes the timestamp. If the site is no longer receiving data, a triangular symbol, with the tooltip Site is not receiving data, precedes the timestamp. • The last received values from all voltage type datasets. • A bell icon with a count of the number of alarms at the site. Click the bell icon to jump to the Alarms screen. |

 in the top-right corner of a graph gadget provides the following options:

 in the top-right corner of a site gadget provides the following options:
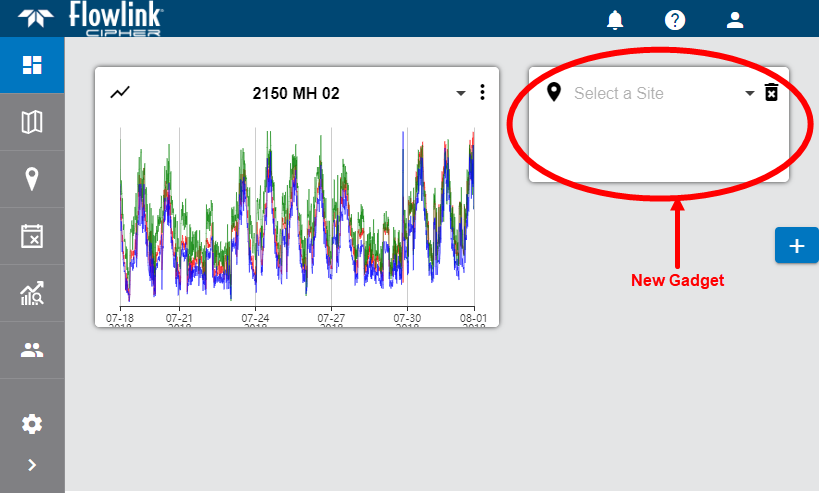
 on the right side of the page to open the tools panel.
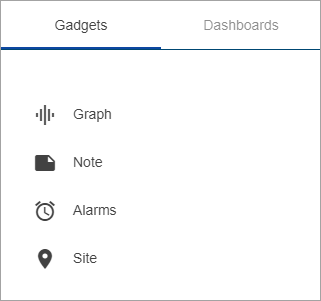
 in the bottom-left corner of the note gadget.
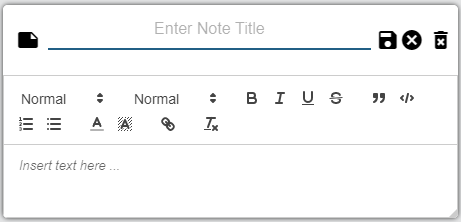
 to save the text and exit edit mode.
 .
. and type a new name for the dashboard.
  to save the dashboard name.
 to save the dashboard name.
 .
.