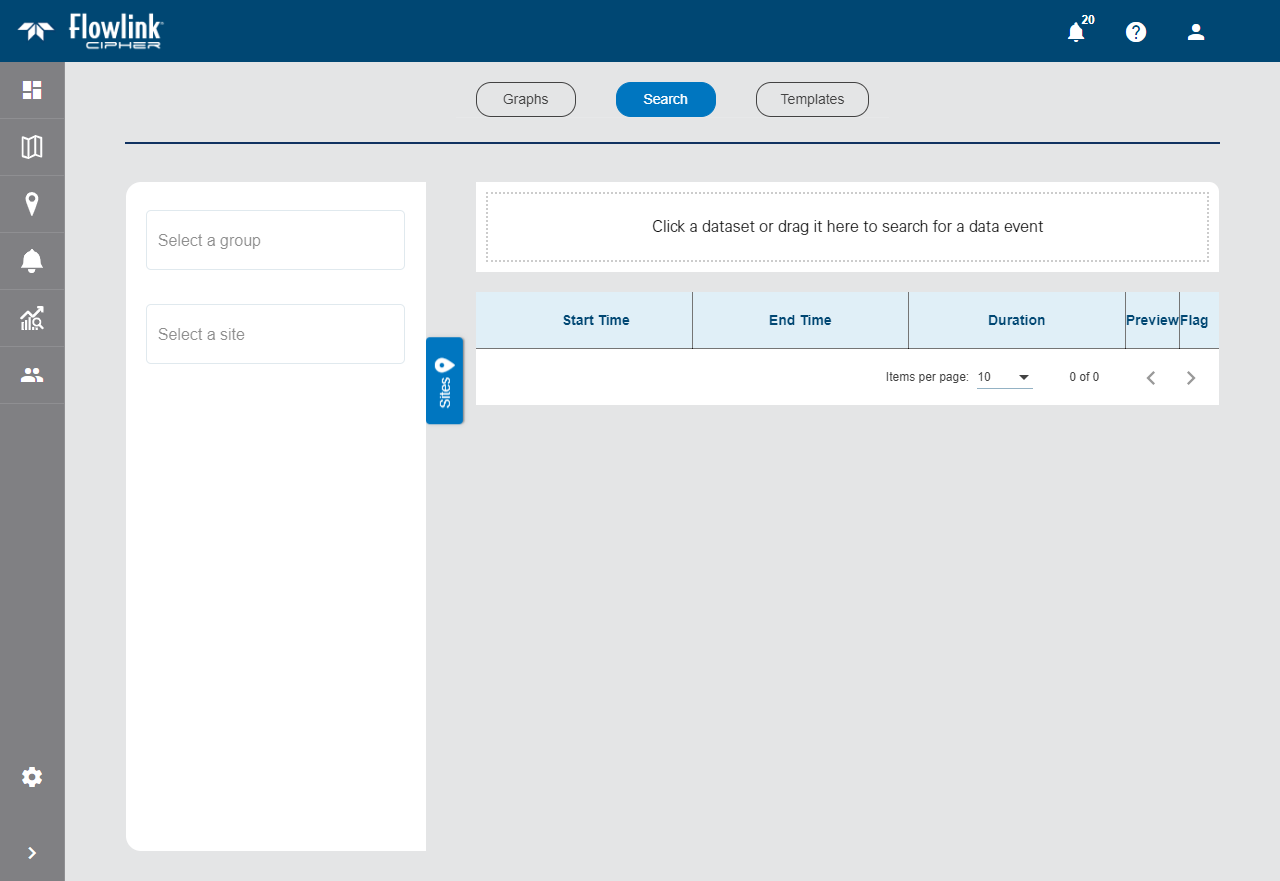
The Search screen of the Analysis page is used to search for specific criteria in the data ingested at a site. Data events can then be created in the dataset for data returned from the search.
1. Expand the Sites panel by clicking the Sites tab.

This tab contains the fields used to select the dataset you want to search. To simplify finding the correct dataset, you can filter the list of available sites by first choosing a site group.
2. [Optional] Click the Select a group field and choose a site group from the list.
3. Click the Select a site field and choose the relevant site from the list.
All ingested datasets and computed datasets available for the selected site will be provided in a drop-down list.
4. Click the desired dataset or drag it into the search field at the top of the page.
The name of the selected dataset will be populated in the search field and additional controls will displayed. These controls are used to define the data conditions the search will look for in the specified dataset.

5. Select a conditional operator by clicking the drop-down arrow inside the Operator field.
6. Type a value in the Value field.
7. Select a unit of measure from the Unit drop-down list.
8. Click the Search button  .
.
Any events that meet the search criteria will be displayed in the table below the search field.
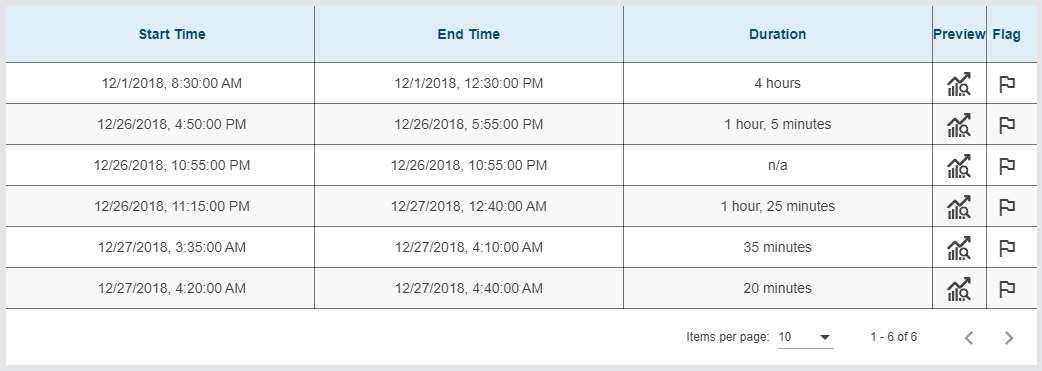
The results list displays a maximum of 10 items by default. This limit can be changed using the Items per page control below the list. Navigation options also appear below the list when the number of items exceeds the set limit and more pages are needed. This control reports the total number of items in the complete list and the number of items in the current page of the list.
9. Select an option from the Items per page drop-down list.
10. Click the Next or Previous arrow to view a different page of search results.
The Preview button  for each row of the search results can be used to view a small graph of the data for that particular event.
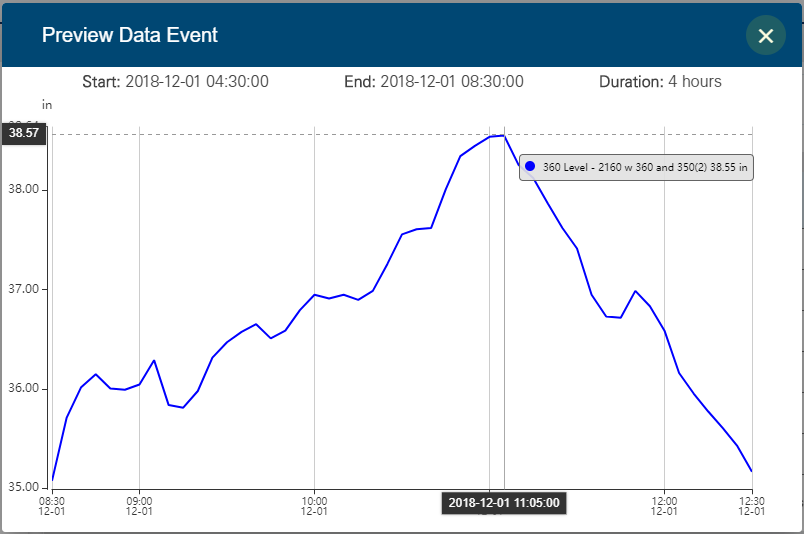
The preview includes the start and end times during which the data was at the specified conditions and the duration of that period. The preview can zoomed in or out using the middle mouse wheel. As the cursor is moved over the data in the preview, a tooltip will be displayed with details of the data at the current location.
The Flag Data Event button  can be used to create a data event in the dataset to mark the data conditions. This will add a data event indicator in a graph created with the data.
11. Click the Flag Data Event button.
A dialog box is displayed to define the data event.
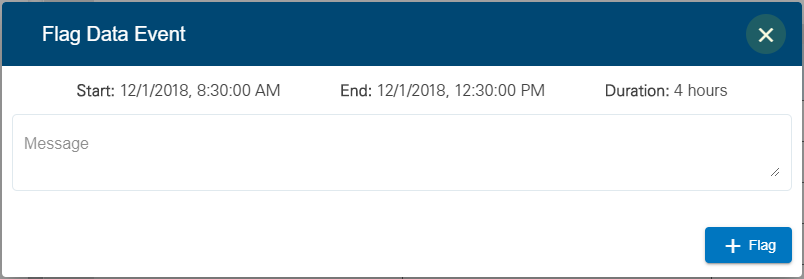
The data event will include the start and end times of the event and the duration of the event.
12. Enter a brief message in the Message field to explain the purpose of the data event.
13. Click the + Flag button.
An indicator will now display in any graphs containing the data. When hovering over an event indicator in a graph, the message entered here will be displayed in a tooltip along with the other data event information.
The Remove Conditions  button can be used to remove the current search conditions and start a new search.