![]() CARIS HPD Paper Chart Editor
CARIS HPD Paper Chart Editor
![]() CARIS HPD Product Editor
CARIS HPD Product Editor
![]() CARIS HPD Source Editor
CARIS HPD Source Editor
Menu | Edit > Soundings > Filter Selected Soundings |
Select soundings in an external S-57 or HOB file for import into one of the following:
• Source usages
• S-57 products
• Paper chart products.
Selected soundings can also be assigned between usages, for example, from a Berthing usage to a Harbour usage, using the Assign Representations command.
This command does not select every sounding in the dataset. You control which soundings are selected using overplot or radius suppression:
• Overplot suppression selects soundings so that there is no overlap, based on size of the sounding which itself is based on the scale at which it will be plotted. You can select the shallowest or deepest soundings that meet the criteria.
• Radius suppression selects soundings within a circular area surrounding each sounding. You define the radius of this area. You can select the shallowest or deepest soundings within the area.
Only soundings that are not suppressed by the process are added to the selection.
Interface: Overplot suppression

Option | Description |
|---|---|
Selection Criteria | Select |
Map scale | The scale at which the selected soundings will be plotted. Type a scale denominator. |
Selection type | Choose from: • Shoal bias: Select shallowest soundings. • Deep bias: Select deepest soundings. |
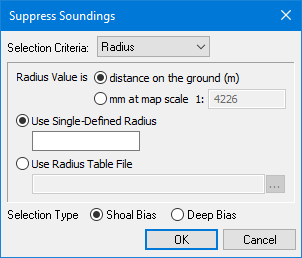
Interface: Radius suppression
Option | Description |
|---|---|
Selection Criteria | Select |
Radius Value | Choose from: • distance on the ground: The unit is metres. • mm at map scale: Type a scale denominator. |
Radius type | Choose from: • Use Single-Defined Radius: Define a single radius to assign the same suppression area around all soundings. Type the radius. • Use Radius Table File: Use a table to set different radius values based on the depth value of the sounding. The table must be in a text file. Click browse (...) to select the table. The sounding radius table lets you define sounding ranges. You can have suppression areas of different size based on the depth of the soundings. There are three columns in the table: • minimum range depth • maximum range depth • suppression radius If the depth of the sounding is between the maximum and minimum depth, the radius is adjusted accordingly. The table must be in a text file. File name and location are user-defined. In this example, the suppression area radius for soundings between 0.0 10.0 1.0 10.0 20.0 2.0 20.0 50.0 5.0 50.0 500.0 10.0 |
Selection Type | Choose from: • Shoal bias: Select shallowest soundings within the defined area. • Deep bias: Select deepest soundings within the defined area. |
Procedure
1. Select soundings in the display.
2. Choose the Filter Selected Sounding command.
The Suppress Soundings dialog box is displayed.
3. Select Overplot or Radius from the Selection Criteria list.
The dialog box changes to display the appropriate options.
4. Define any necessary options.
5. Click OK.